

![]()
Journalist
Published on:
- TRUMP has regained a bullish structure on the 4-hour chart.
- Increased open interest and strong demand over the last 48 hours indicate a resurgence of buyers.
Official Trump [TRUMP] has awakened from a week and a half of inactivity, where it was trading within the $14.6 to $17.9 range.
The trading volume remained subdued, and it seemed that a continuation of the previous downtrend could occur if Bitcoin [BTC] encountered further adverse news.
However, TRUMP experienced a swift price rally on February 14, turning the $17.88 mark into a support level.
Is this popular memecoin poised for another upward movement to capture the interest of traders?
TRUMP: Is an Uptrend on the Horizon?
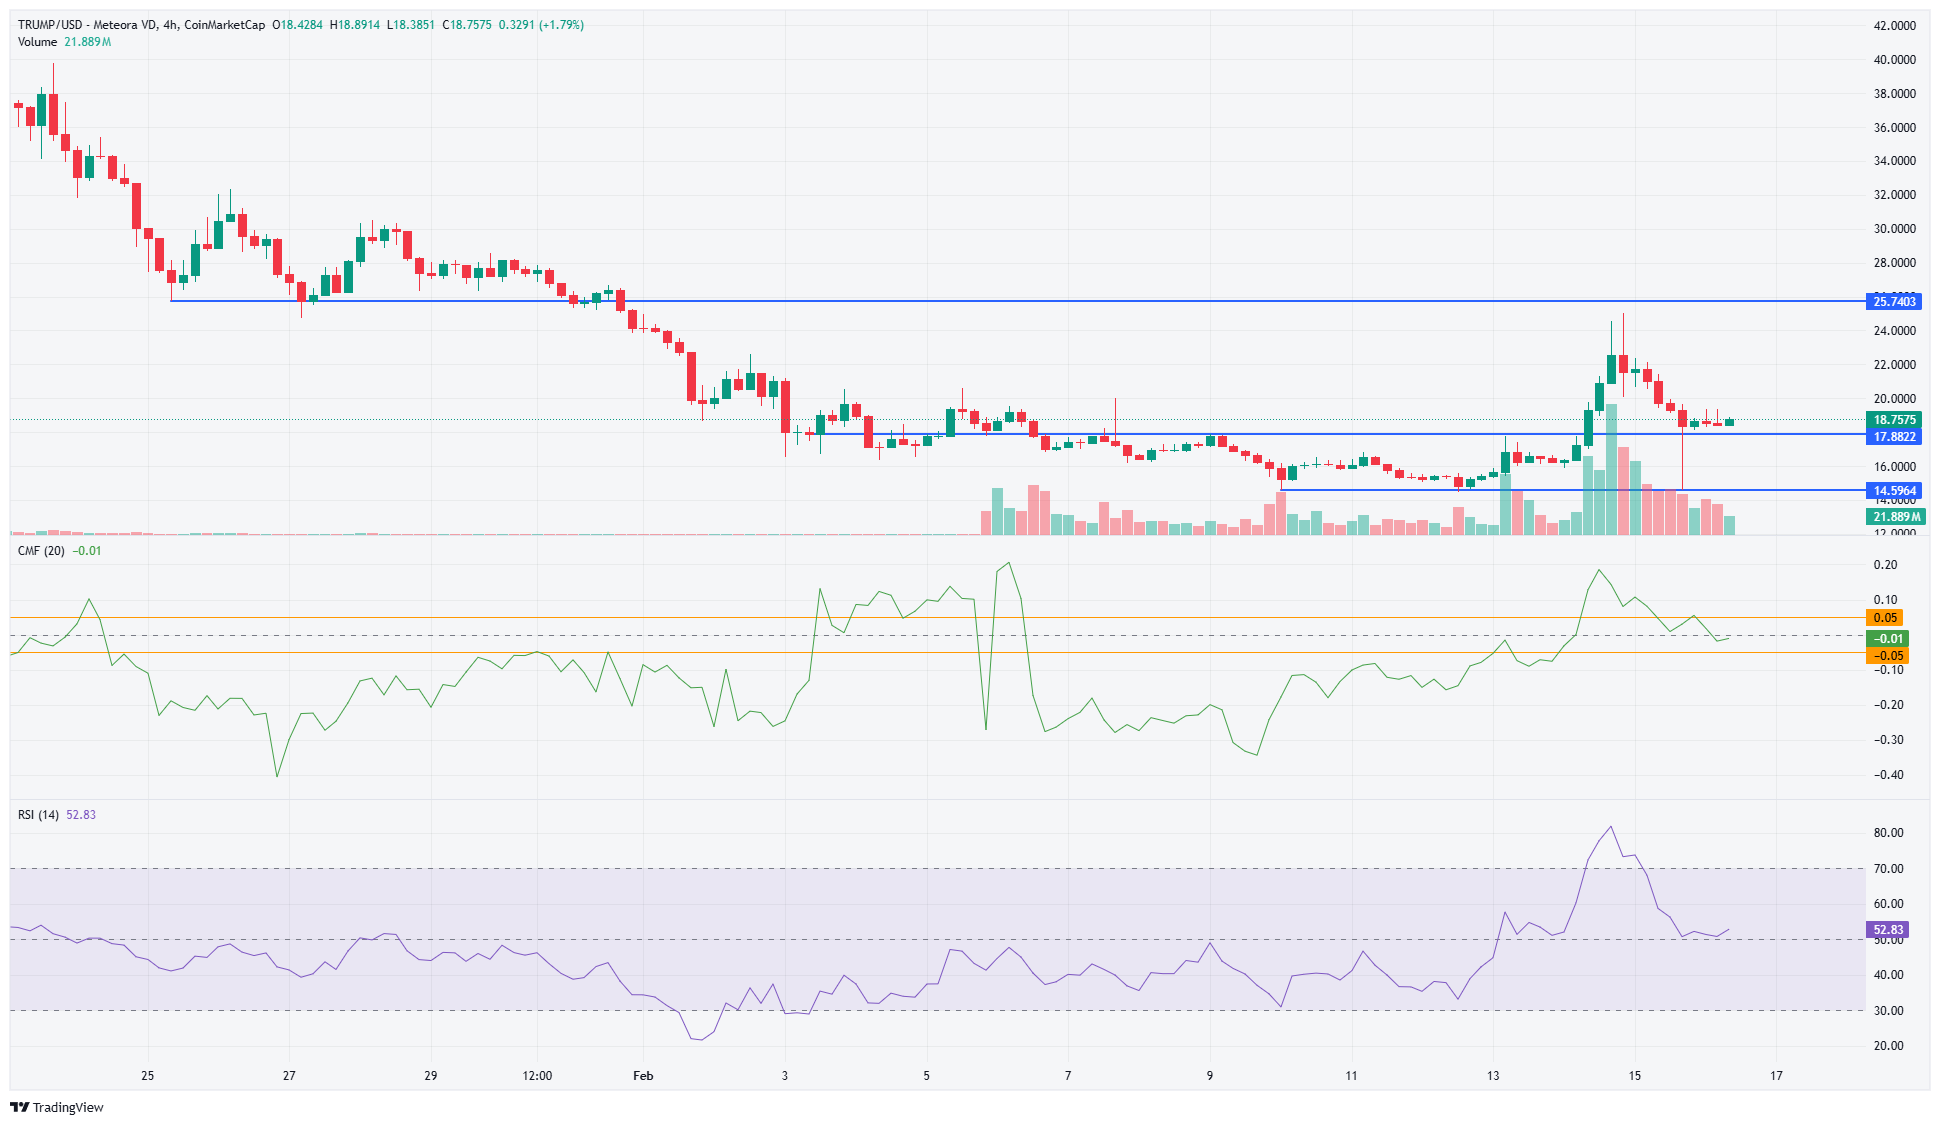
Source: TRUMP/USDT on TradingView
Since the early February market dip, Official Trump fluctuated between $17.88 and $14.6, with these values marking the recent high and low.
The preceding downtrend recorded a peak of $17.88.
The breakthrough of this level on February 14 indicated a potential shift in market structure.
Following this, the price has seemingly established a higher low, but confirmation will rely on TRUMP hitting a new high above $22.55. The swift drop to $15 observed the previous day indicates that bullish momentum is not yet fully established.
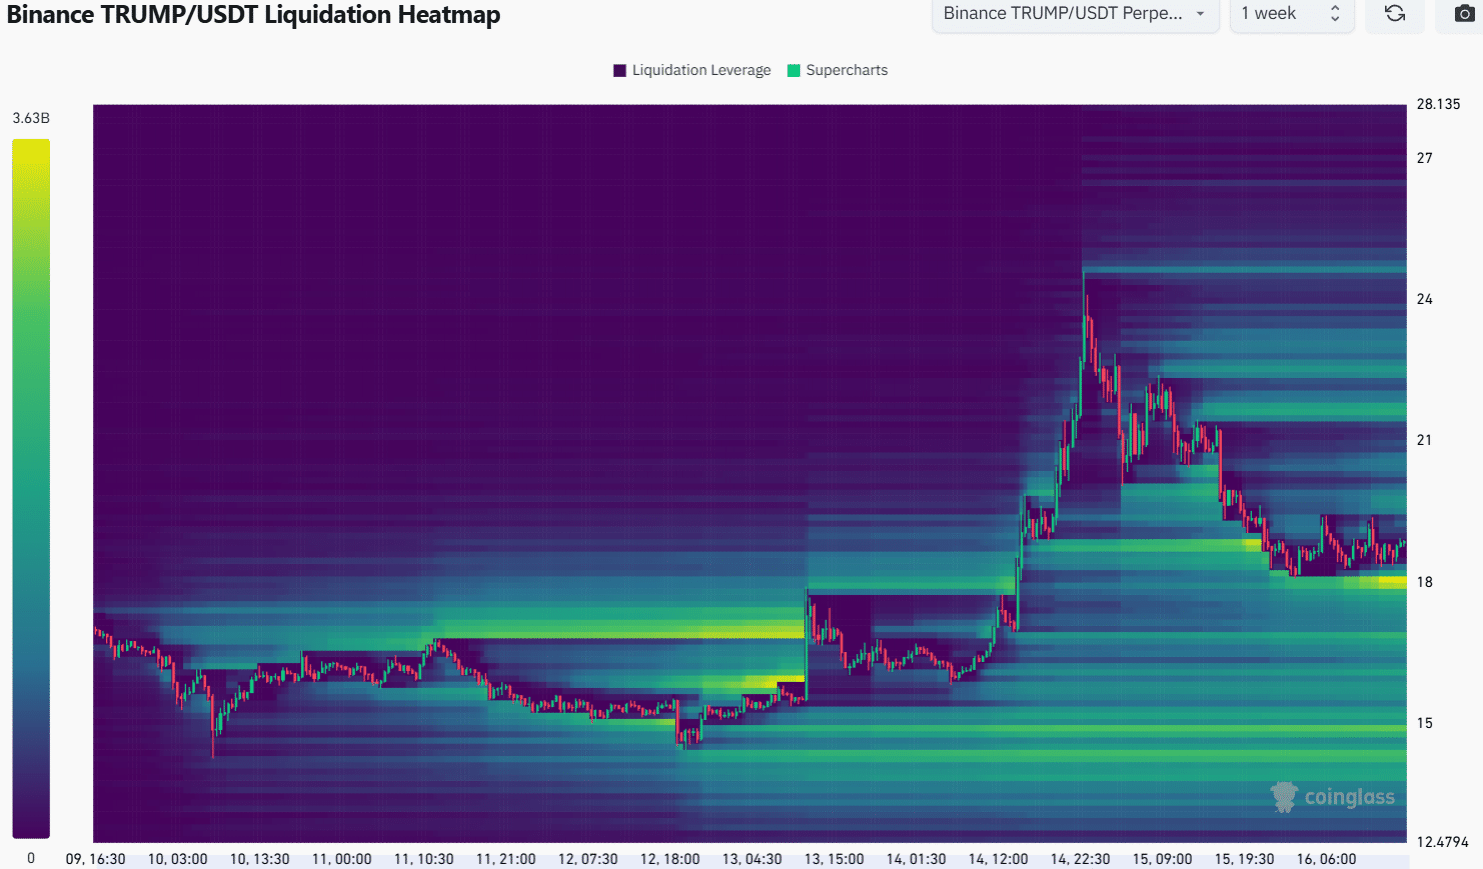
Source: Coinglass
The liquidation heatmap from the last two weeks has pinpointed the $18 area as a key level of interest. This zone is notably close to the current price, unlike liquidity clusters found at higher levels like $21.63.
Thus, TRUMP may potentially retest the $18 mark before attempting further upward movement.
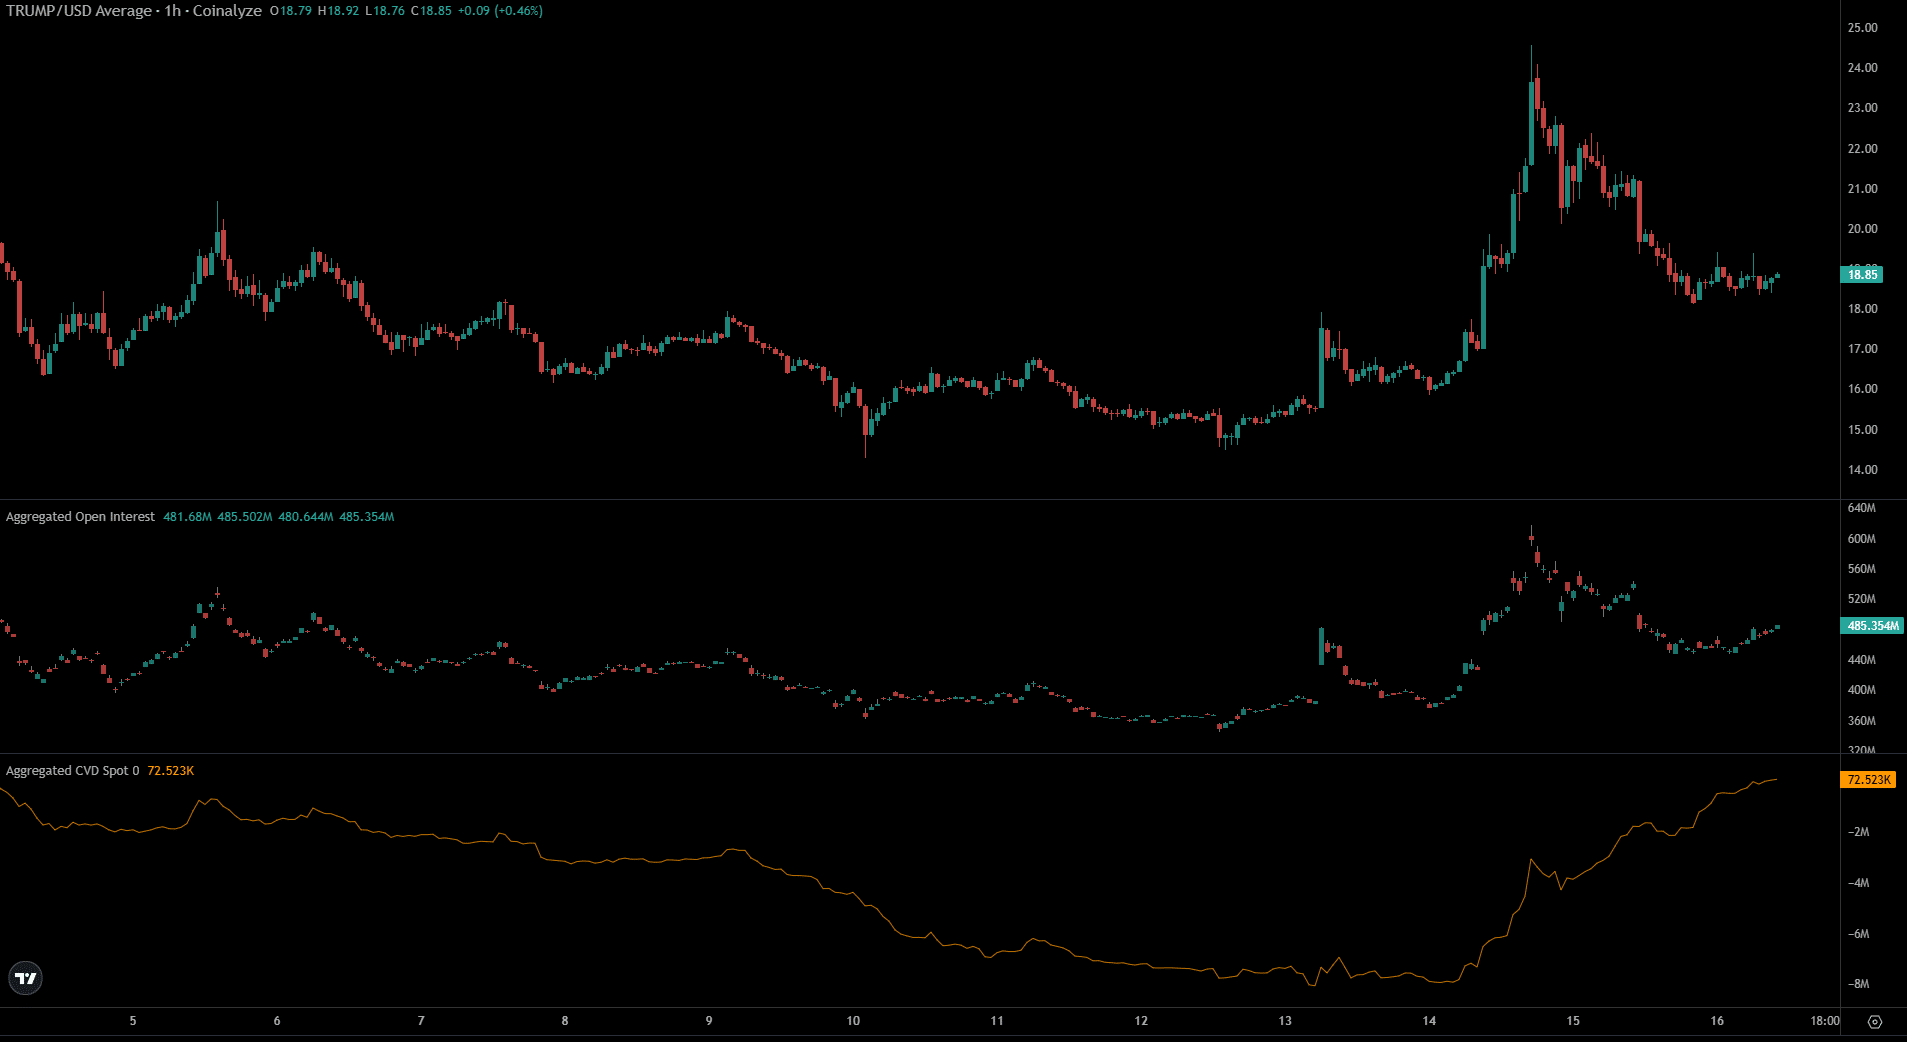
Source: Coinalyze
While the heatmap suggested a minor price pullback, both spot cumulative volume delta and open interest have indicated a strengthening bullish sentiment. Particularly, the spot demand has shown considerable strength in the past two days.
If these trends persist, it may propel TRUMP beyond the local resistance level at $22.6.
Overall, both price movement and technical indicators suggest a short-term bullish outlook.
However, a drop below the local support at $17.88 would negate this bullish scenario. Continued formation of lower highs and lower lows would point towards the resumption of a downtrend.
Disclaimer: The content provided here is for informational purposes only and does not constitute financial, investment, or trading advice. It represents the author’s perspective.