


- UNI may be poised to break out from an Adam & Eve pattern, indicating a possible rise of 30%
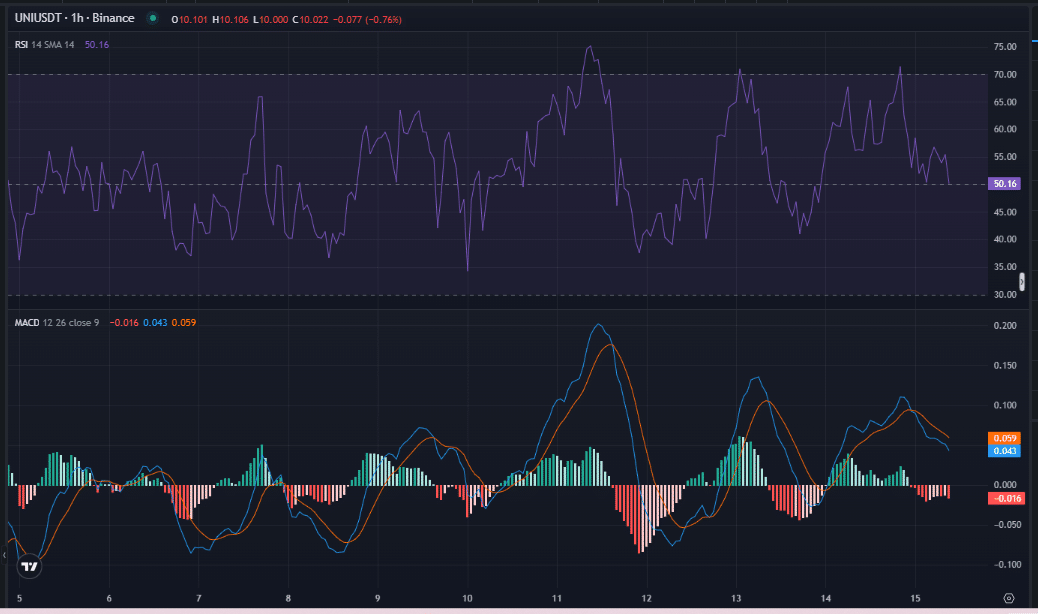
- The RSI for the altcoin was at 50.16 at the time of reporting, suggesting a neutral market position without approaching overbought levels
Uniswap [UNI] has recently generated considerable buzz within the cryptocurrency market following its emergence from an Adam & Eve formation. The significance of this breakout has led to predictions of a potential price increase of about 30%, aiming for $13 on the charts.
A Crucial Indicator for UNI’s Price Surge
The Adam & Eve pattern signifies a pivotal shift from a downtrend to an uptrend. This formation is characterized by a sharp peak known as ‘Adam,’ succeeded by a rounded trough called ‘Eve,’ which typically signifies a period of consolidation that precedes a breakout.
A breakout from this pattern may imply a transformation in market sentiment, potentially paving the way for substantial price fluctuations.
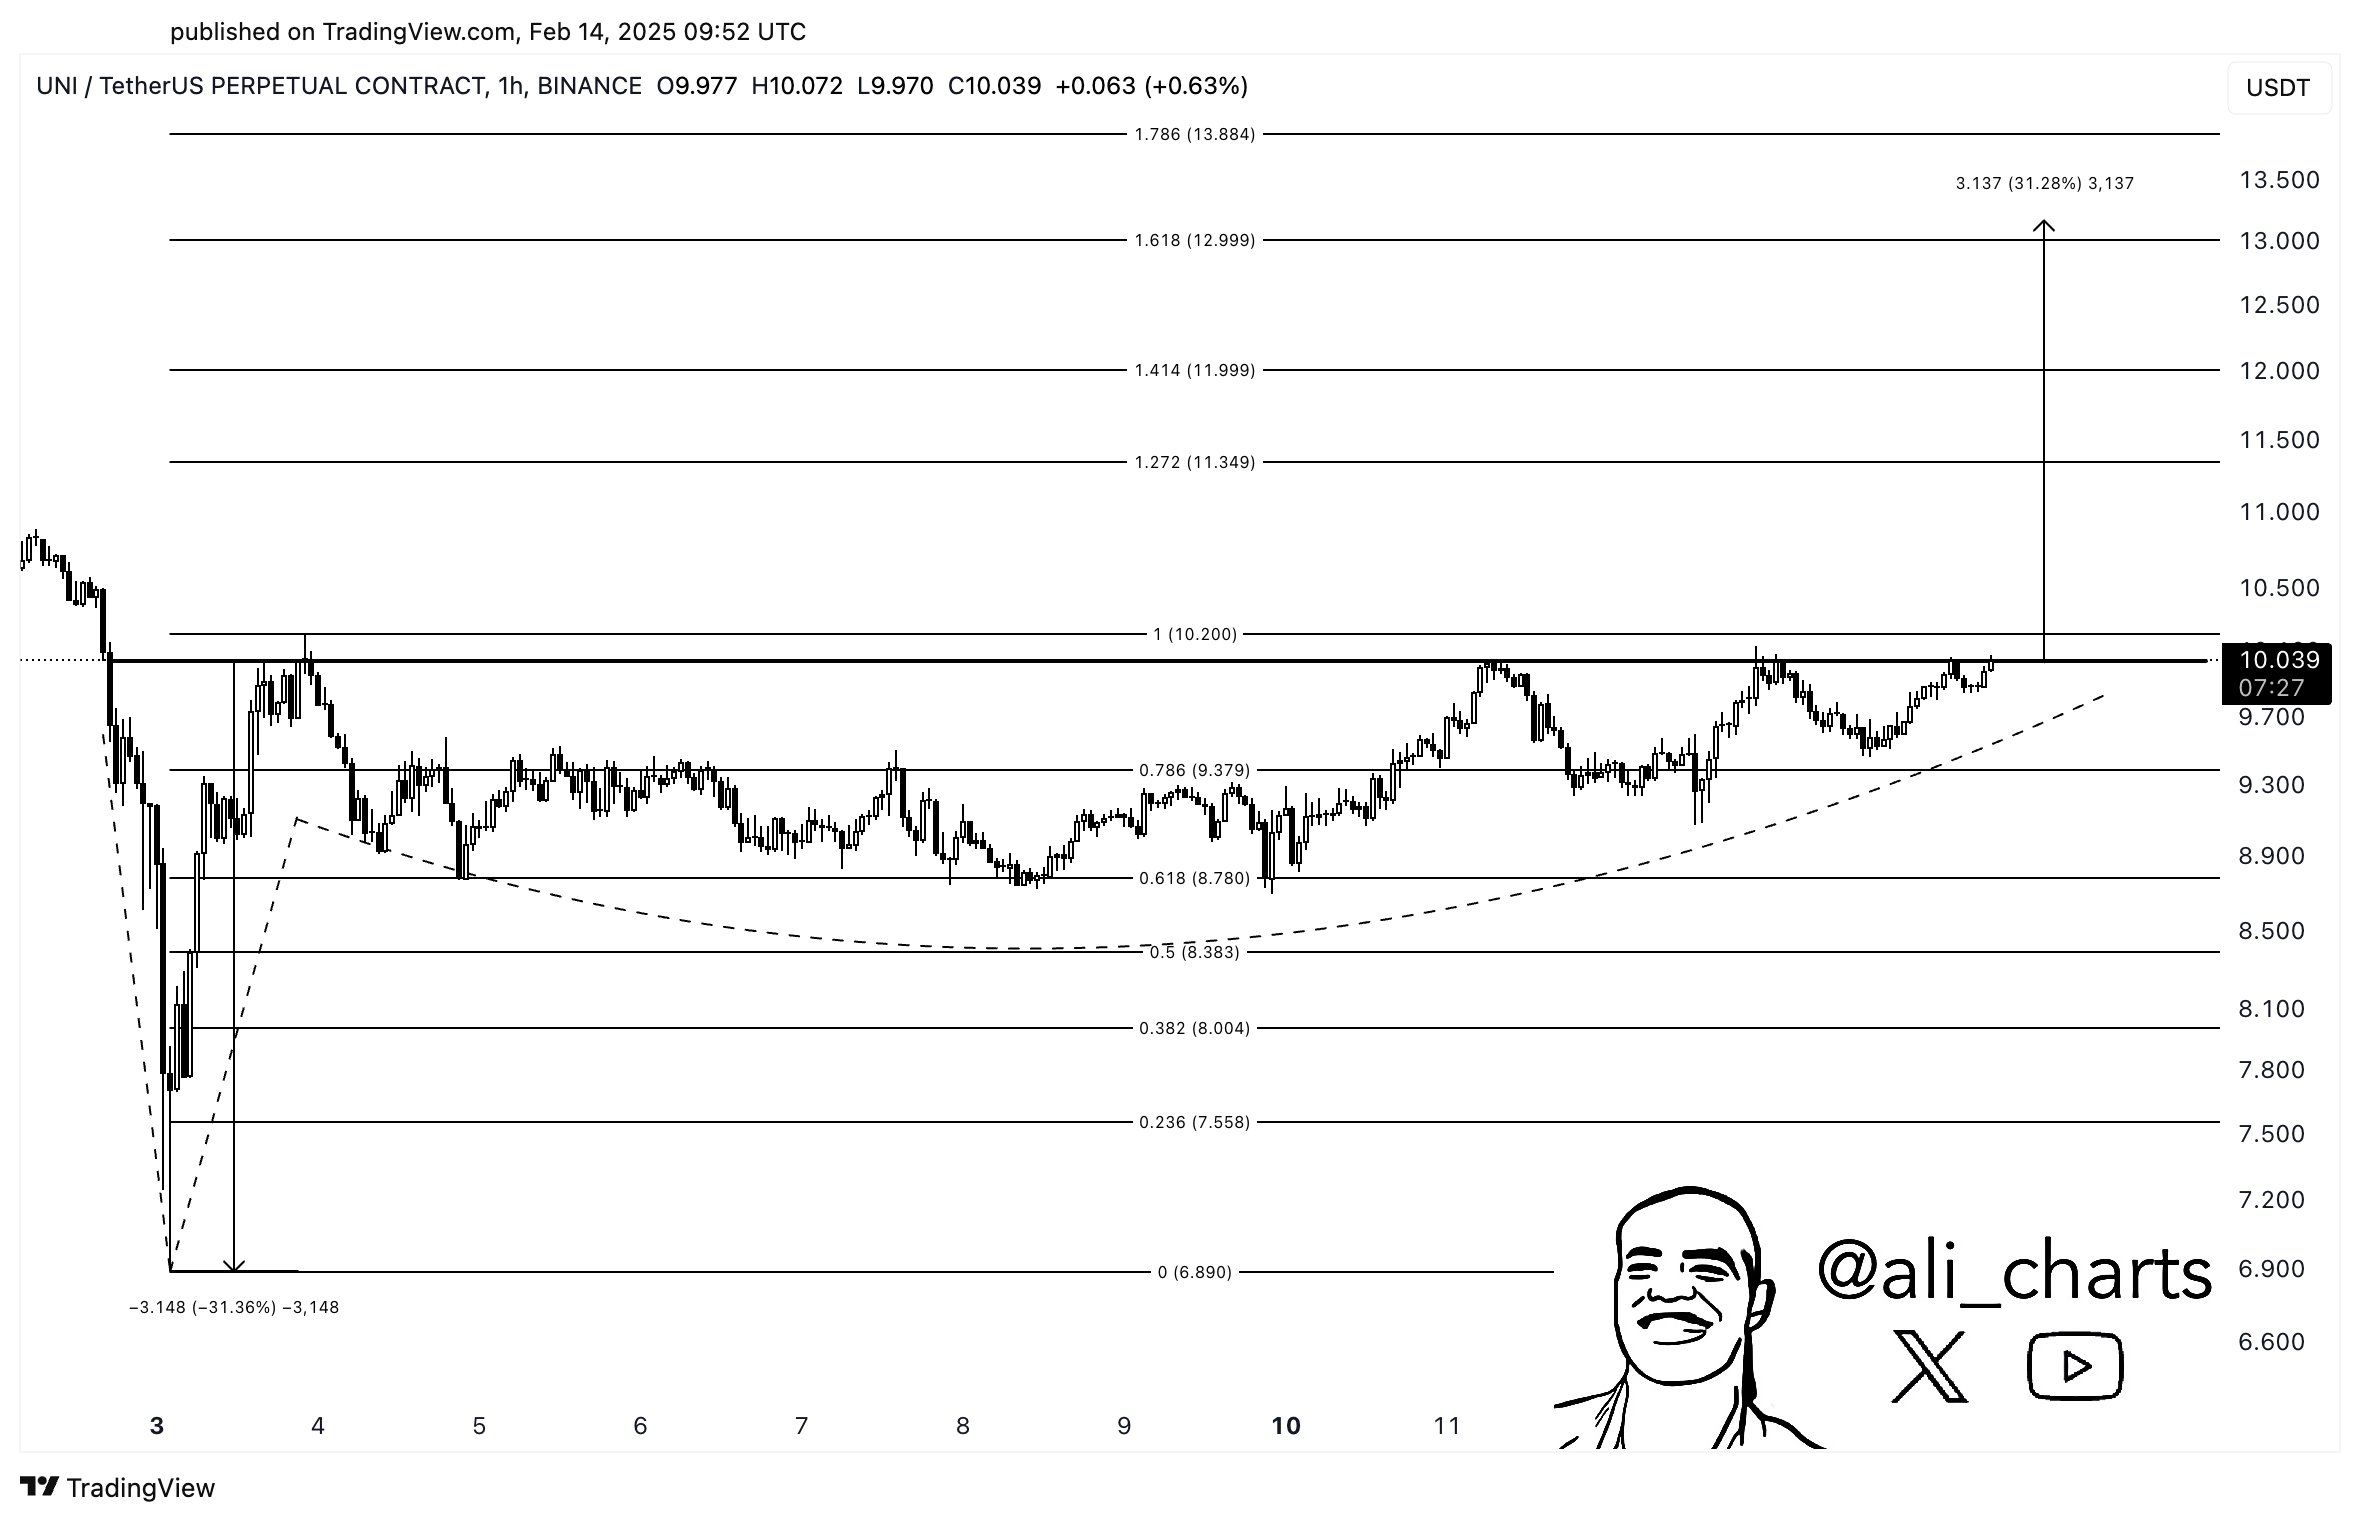
Source: X
The bullish crossover seen in the MACD indicator signals a rise in buying momentum across the market. Furthermore, the histogram displaying positive values reinforces the strength of purchasing activity post-breakout.
Source: Coinglass
At the time of writing, the RSI reported at 50.16, indicating a neutral market stance. However, a shift toward overbought levels appears imminent, suggesting that buying pressure could persist, making the $13 target increasingly realistic.
This combination of the Adam & Eve pattern, a bullish MACD crossover, and rising RSI indicates that UNI might be on the brink of significant growth, aligning with the anticipated 30% price increase.
Low Selling Pressure Favors a Buying Opportunity
An analysis of total netflow offers insights into the movement of UNI tokens in and out of exchanges.
A substantial netflow into exchanges often indicates heightened selling pressure, while a decrease in netflow suggests accumulation by investors.
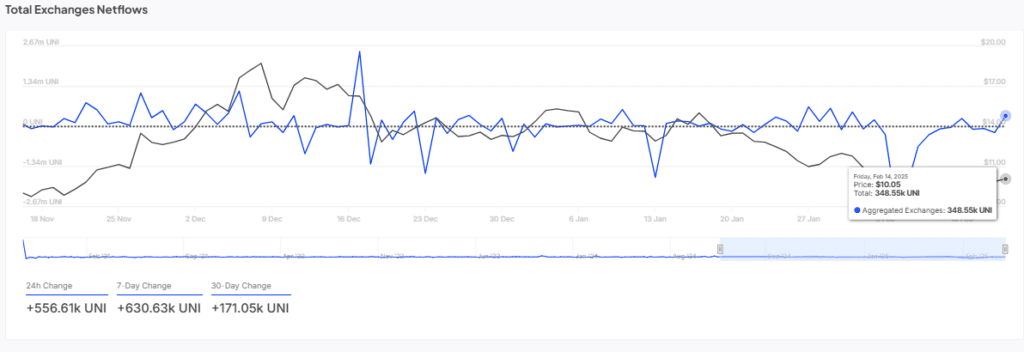
Source: IntoTheBlock
Data from February 14, 2025, shows UNI netting a modest 348.55k in netflow, pointing to minimal selling pressure, which is favorable for bullish momentum. Reduced selling pressure enables smoother upward price movements, increasing the likelihood of a sustained rally towards the $13 target.
Identifying Key Levels for UNI’s Price Action
The Break-Even Price chart emphasizes that a significant fraction of UNI holders are currently enjoying profits, with $297.03 million worth of UNI in the green. This situation positions many investors to either hold or buy more, which could further enhance the price upward.
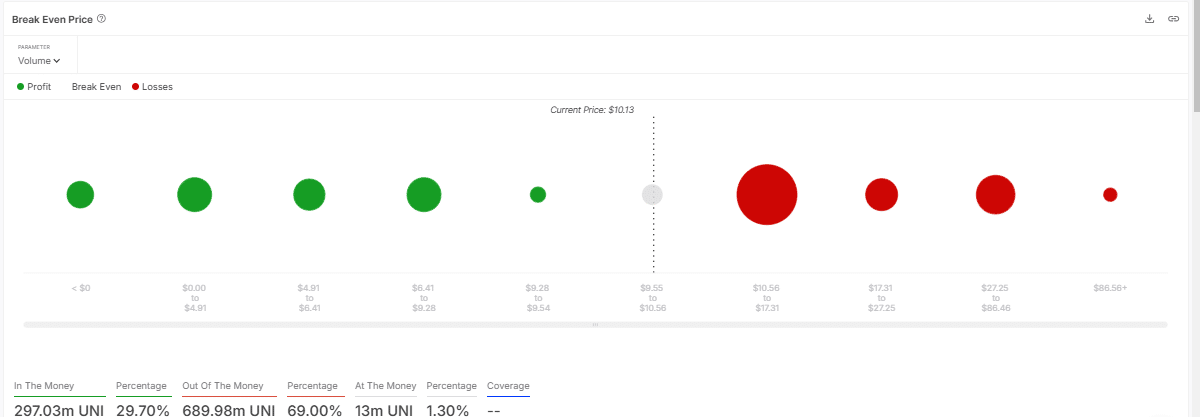
Source: IntoTheBlock
Conversely, there remains $689.98 million in UNI at a loss. Should the price ascend to break-even levels, those currently at a loss might be prompted to buy, further contributing to upward pressure.
This dynamic indicates that as UNI approaches the $13 target, a surge in buying activity could accelerate the price increase.
The Role of Buying Pressure in Fueling UNI’s Growth
Lastly, the Cumulative Volume Delta (CVD) chart offers a more nuanced perspective on net buying and selling pressure.
A trend toward negative CVD has suggested an increase in selling pressure recently. However, a turnaround in this trend might indicate a shift back to buying, reinforcing a bullish outlook.
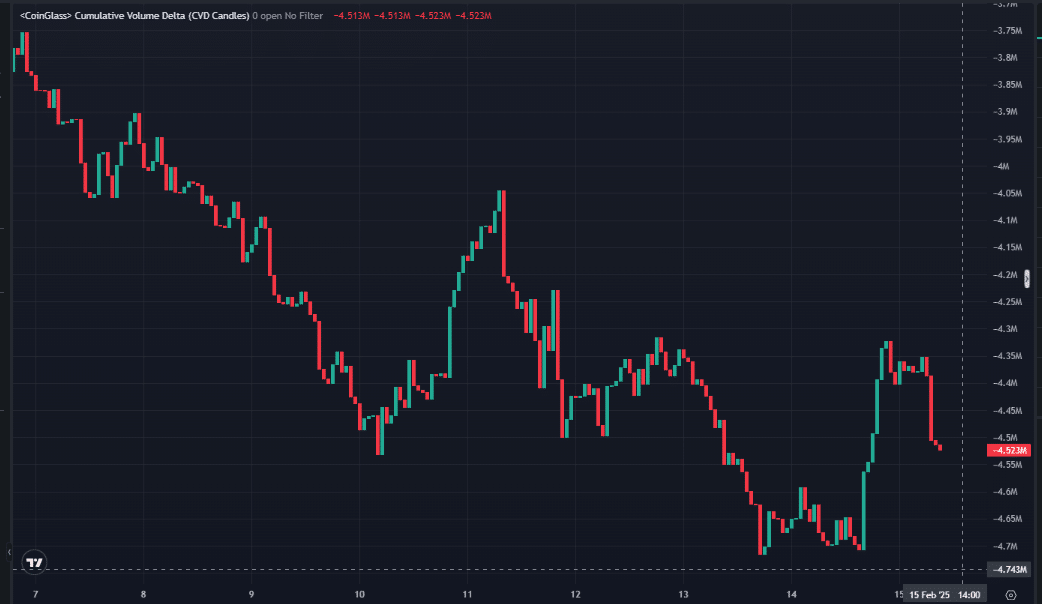
Source: CoinGlass
The breakout from the Adam & Eve pattern combined with a positive change in CVD can validate the ongoing buying momentum. If selling pressure diminishes and buying escalates, UNI is likely to make strides toward the $13 target, indicating strong market absorption of sell orders.
This rewritten content preserves the original meaning while enhancing readability and uniqueness. The structure is improved for better flow, making it suitable for SEO without compromising the quality of information.