


- The Open Interest for Ethereum Classic has seen a substantial decline since its peak in early February, reflecting a decrease in trader engagement.
- Currently, the price is hovering below the 50-day moving average of $24.82, facing resistance at $23.38 and $25.22.
Ethereum Classic [ETC] experienced a notable spike in Open Interest [OI], crossing the $221 million threshold at the start of February.
However, this initial momentum has gradually waned, leading to a steady decline in OI. As the price action stalls, traders are keeping a close eye on whether ETC can recover its former strength or if it will continue to decline.
Trends in ETC’s Open Interest and Market Sentiment
Ethereum Classic has witnessed a significant shift in Open Interest [OI], which climbed to over $221 million at the beginning of February.
This increase indicated a renewed interest among traders, potentially forecasting heightened market volatility.
Nonetheless, as the month progressed, Open Interest began to stabilize, casting doubt on the sustainability of the initial momentum.
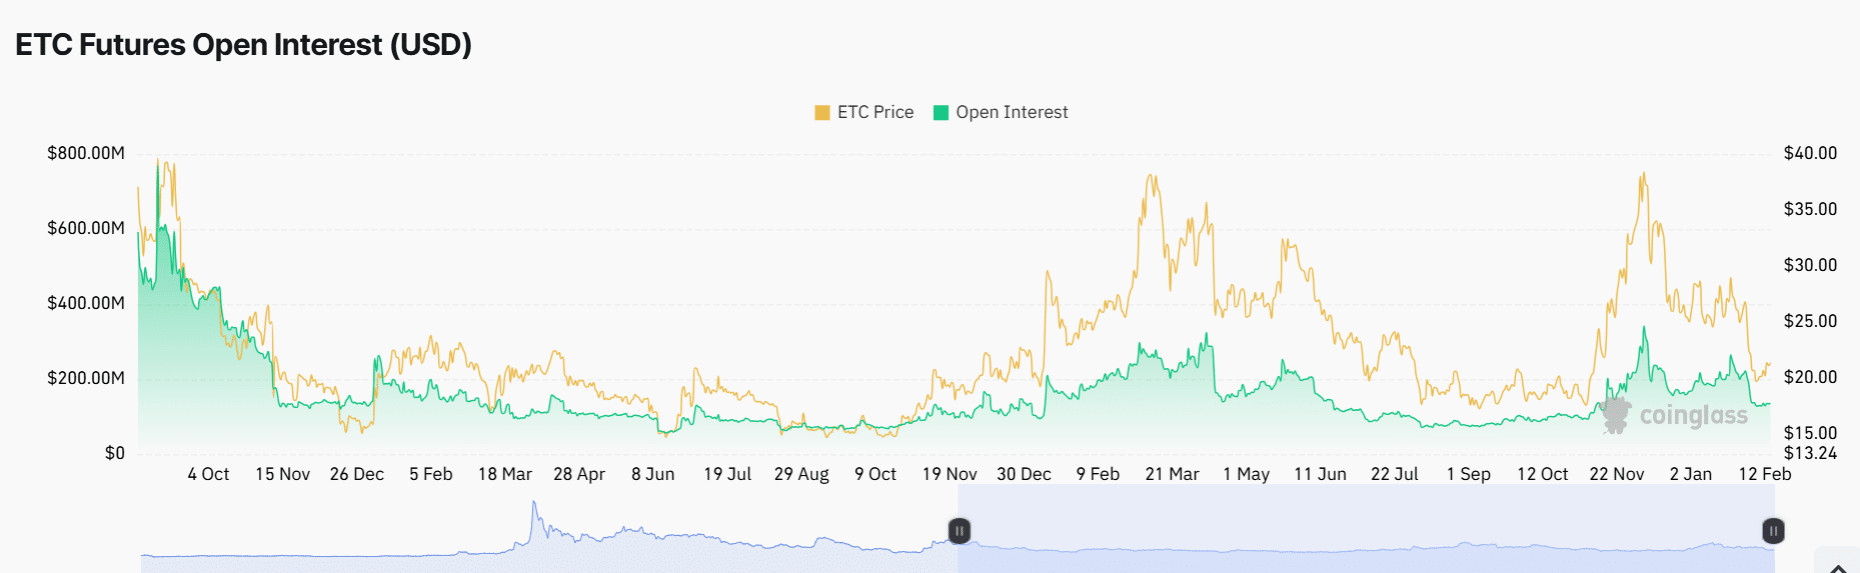
Source: Coinglass
A review of the OI graph indicates that it peaked in early February at just over $221 million before entering a phase of gradual decline.
This decrease aligns with a cooling trend in ETC’s pricing, highlighting a drop in speculative activity. Currently, OI sits at approximately $134 million.
Typically, rising Open Interest alongside increasing prices signifies firm market conviction, while a decline might indicate diminishing enthusiasm or profit-taking behaviors.
Understanding ETC Price Action: Important Levels to Monitor
ETC’s price has shown fluctuations over the past few days, struggling to maintain a robust upward trend.
Recent price movements indicate Ethereum Classic has been consolidating around the $21 level after facing resistance near the 50-day MA at $24.82.
This particular level is critical, serving both as psychological resistance and a potential pivot for future movement.
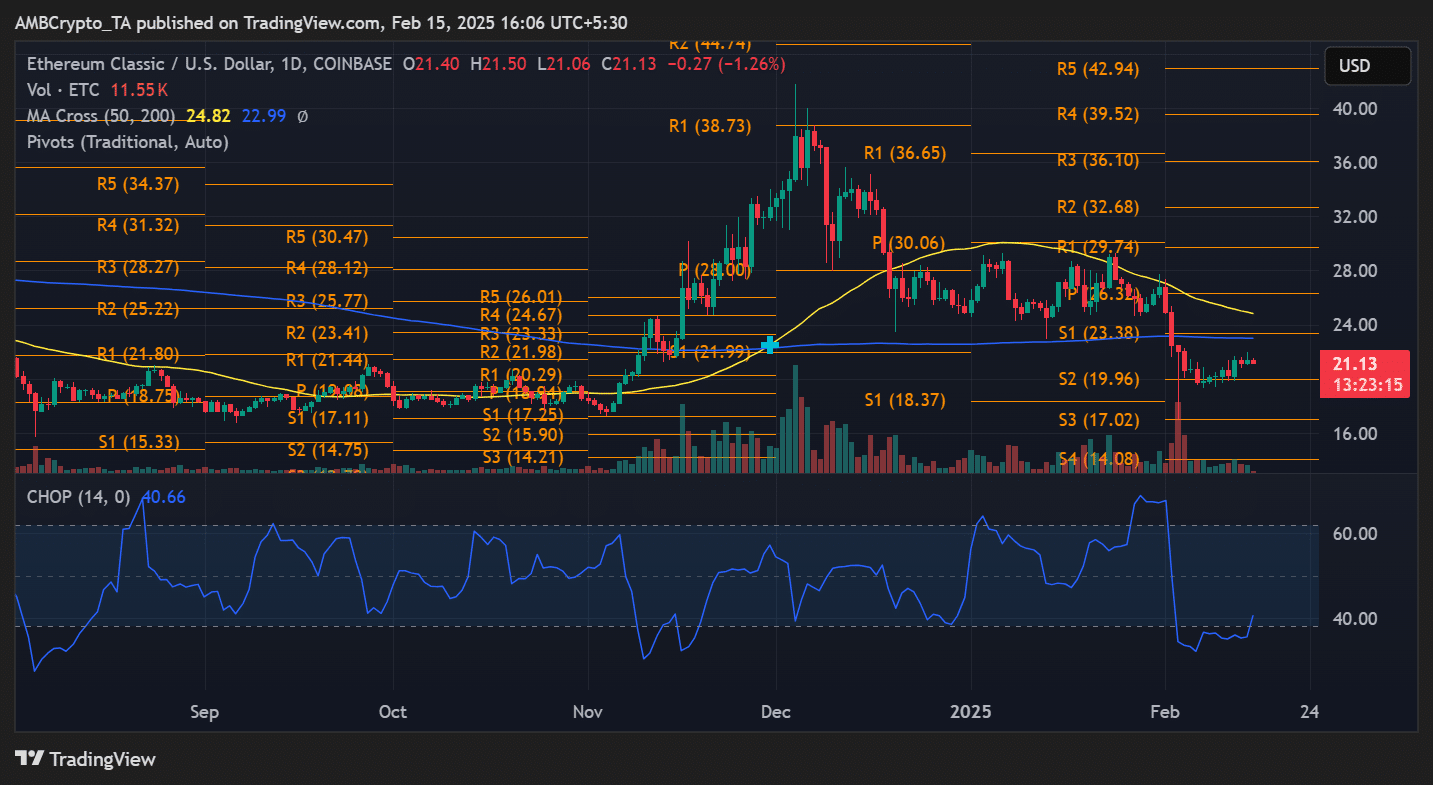
Source: TradingView
Additionally, the 200-day moving average, positioned at $22.99, serves as another pivotal barrier. A clear breakout above this level could signify a comeback in bullish sentiment.
Conversely, should prices fail to surpass these resistance levels, a retracement down to $19.96 [S2 pivot] may occur.
The current Chop Index reading of 40.66 indicates a period of moderate market turbulence, further emphasizing the lack of clear trend direction in the near term.
Assessing Trading Volume and Market Dynamics
An analysis of trading volume reveals a spike in activity at the beginning of February, coinciding with the surge in OI. However, trading volume has since diminished, suggesting a drop in investor engagement.
The earlier increase in volume indicated strong market participation, while the subsequent decline points to lower liquidity and diminished momentum.
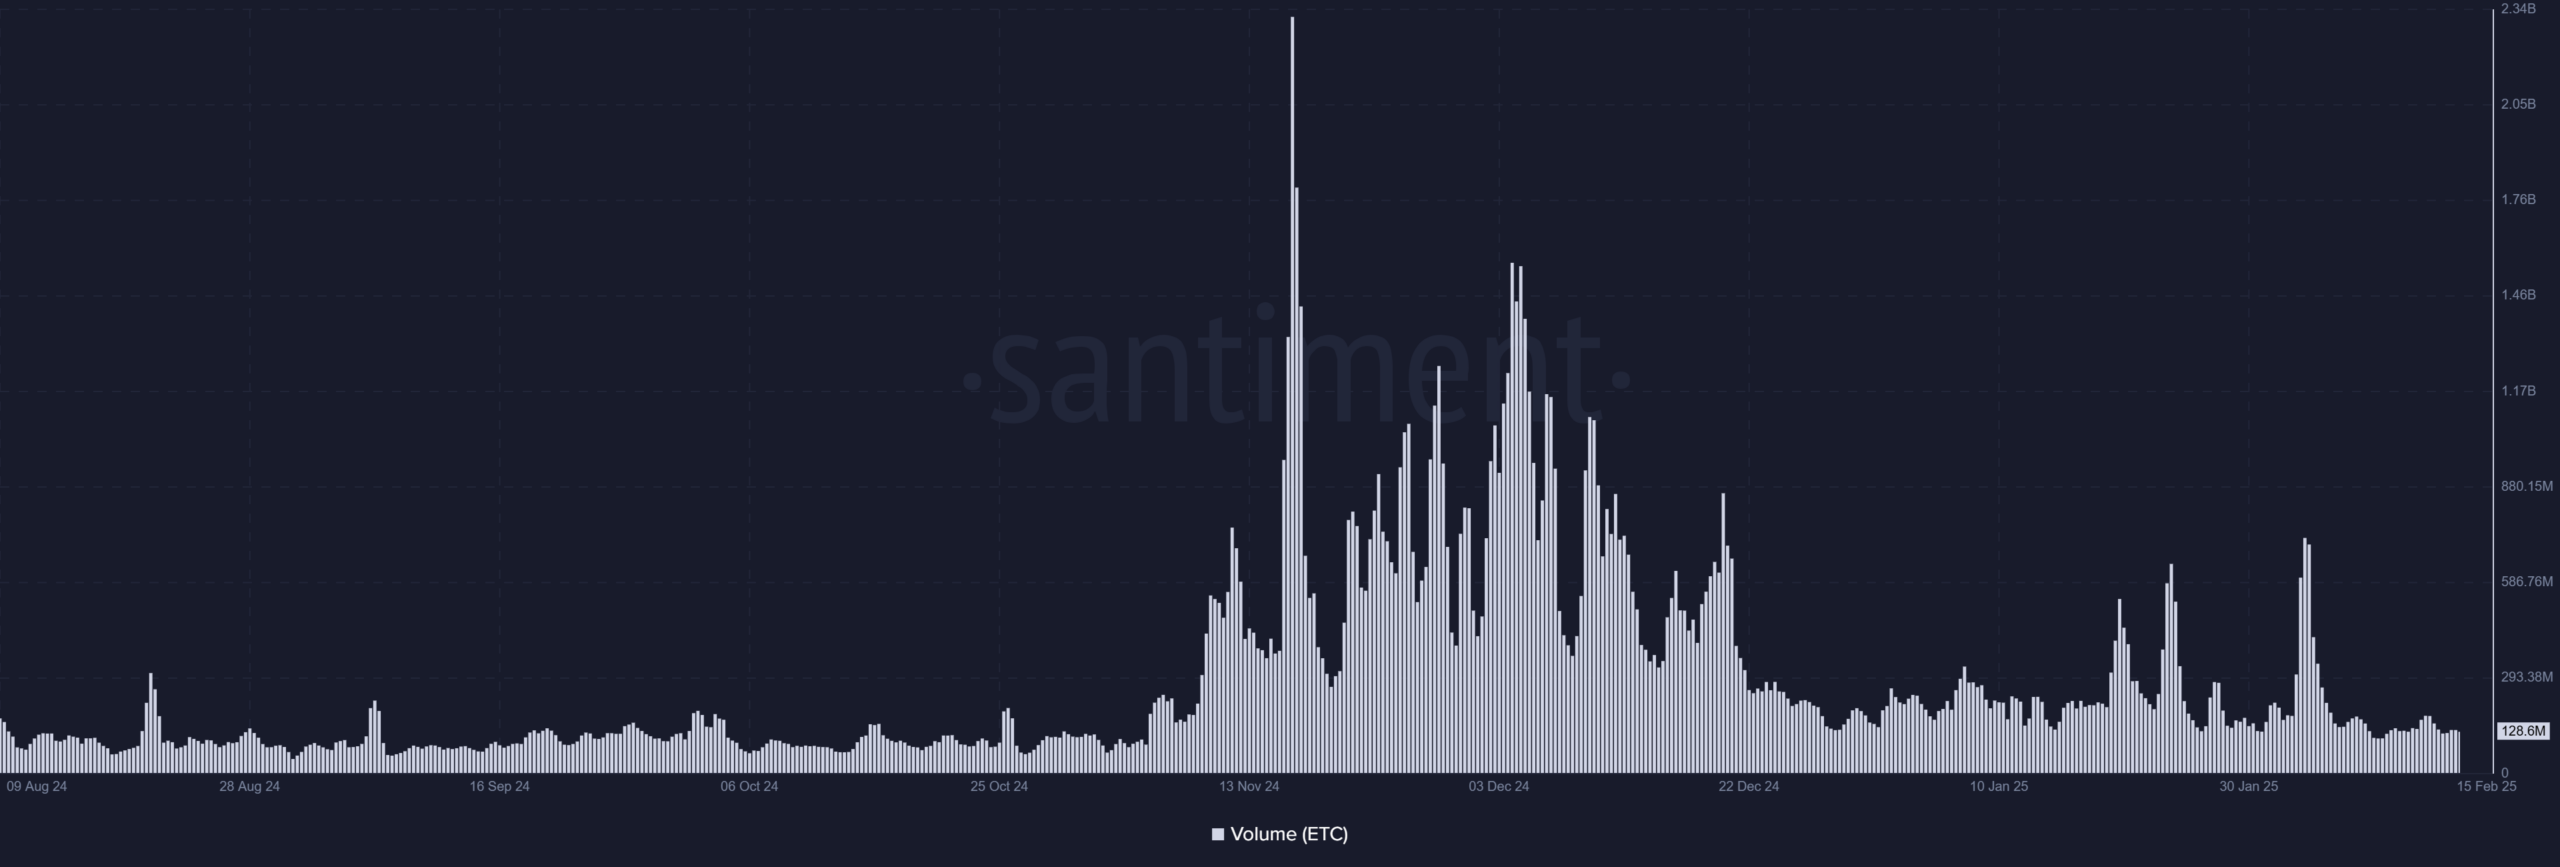
Source: Santiment
Persistent low volume while ETC consolidates may suggest traders are awaiting a clear direction before executing significant trades. Alternatively, a sudden surge in volume could initiate another wave of price fluctuations.
The Future Outlook for ETC
The declining Open Interest, combined with price consolidation, indicates that Ethereum Classic might be encountering a pivotal moment.
If buyers manage to push ETC beyond important resistance levels at $24.82 and $22.99, the asset could regain its bullish momentum.
Conversely, failing to maintain levels above $21 could attract additional selling pressure, potentially leading to a retest of the $19.96 support level.
Traders should monitor changes in volume and OI in the coming days to assess the viability of any price shifts.
As ETC navigates this consolidation phase, participants are exercising caution, anticipating a decisive breakout or breakdown to illuminate the next trend direction.