


![]()
Reporter
Published:
- Ethereum continues to exhibit a bearish trend in the market.
- Liquidation levels suggest a possible rebound to $2,880.
The price of Ethereum (ETH) has dropped below the $2,800 mark, a level that previously served as significant resistance from August to November 2024.
It has been disheartening for investors as ETH and many altcoins suffered considerable losses in November.
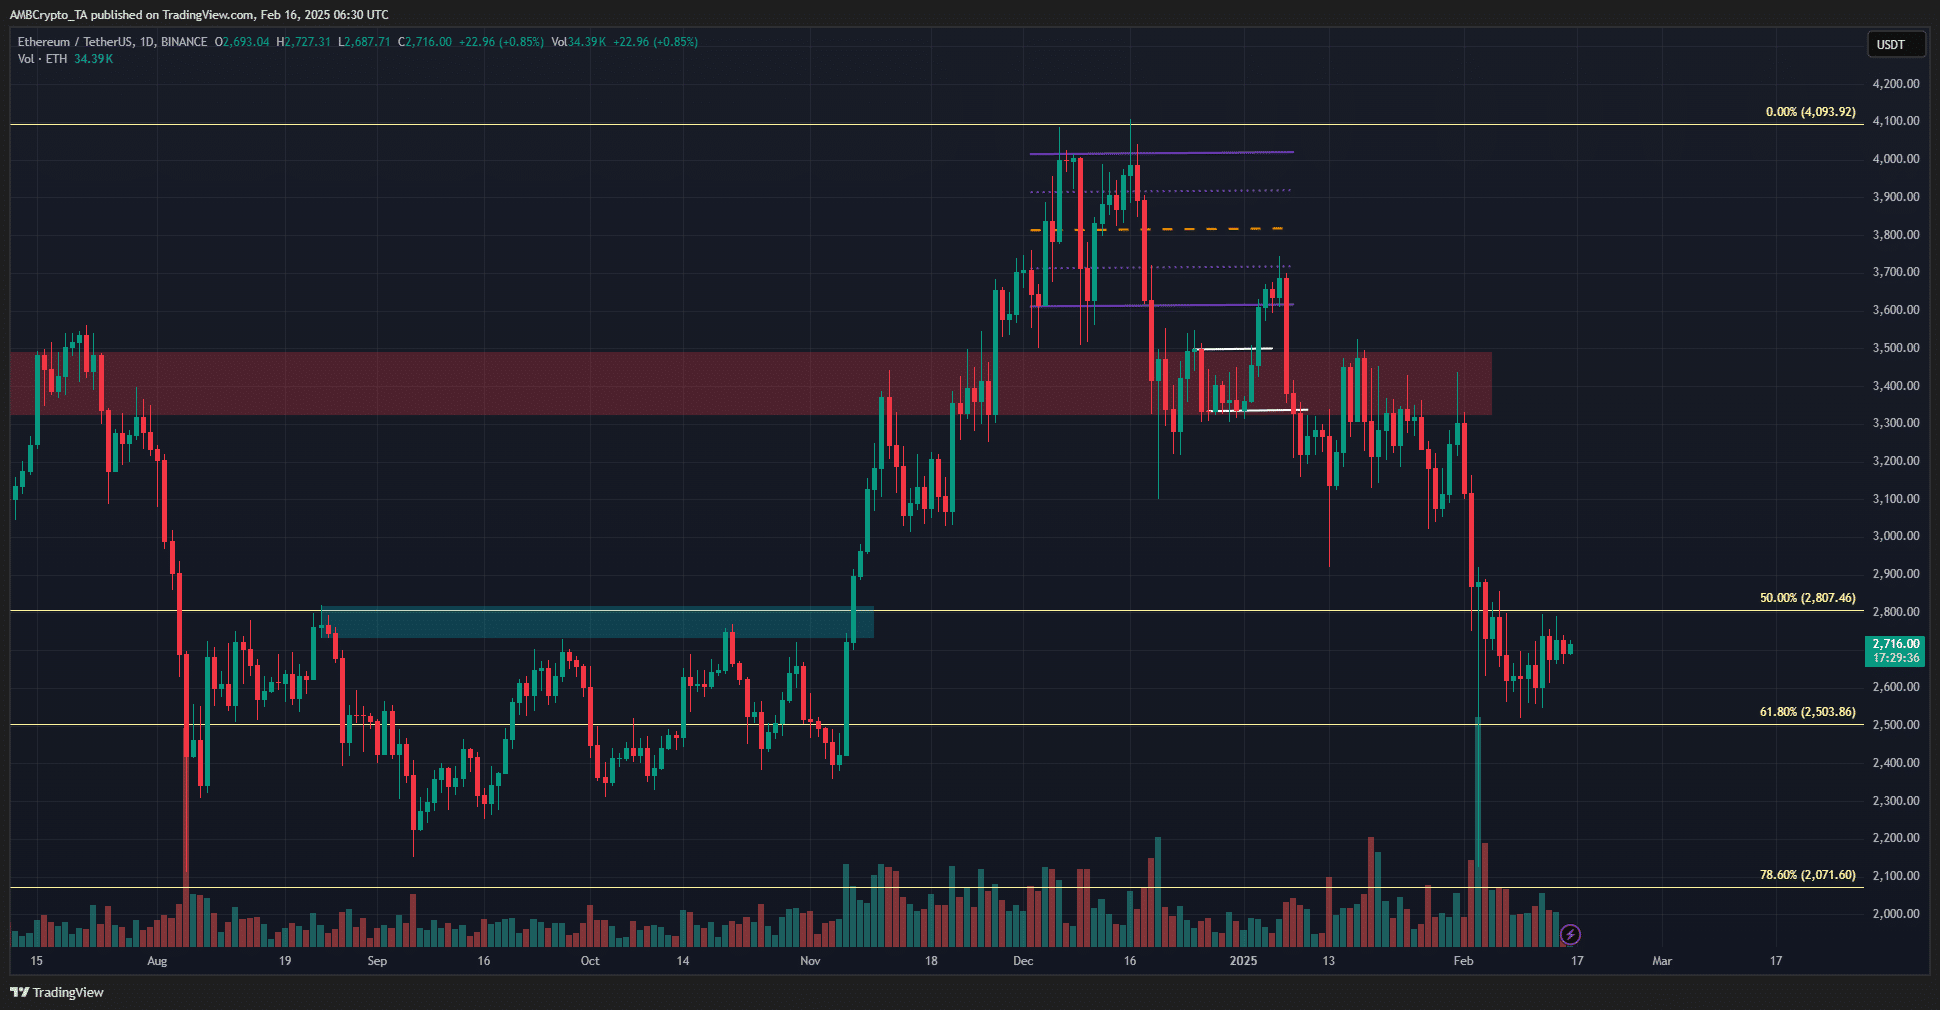
Source: ETH/USDT on TradingView
From a technical perspective, the 61.8% and 78.6% Fibonacci retracement levels have effectively served as support. However, the daily market structure remains bearish, with purchasing pressure stalling.
Various indicators, including the liquidation heatmap, have provided insights into potential future movements.
Estimated Leverage Ratio and Potential ETH Liquidity Hunt
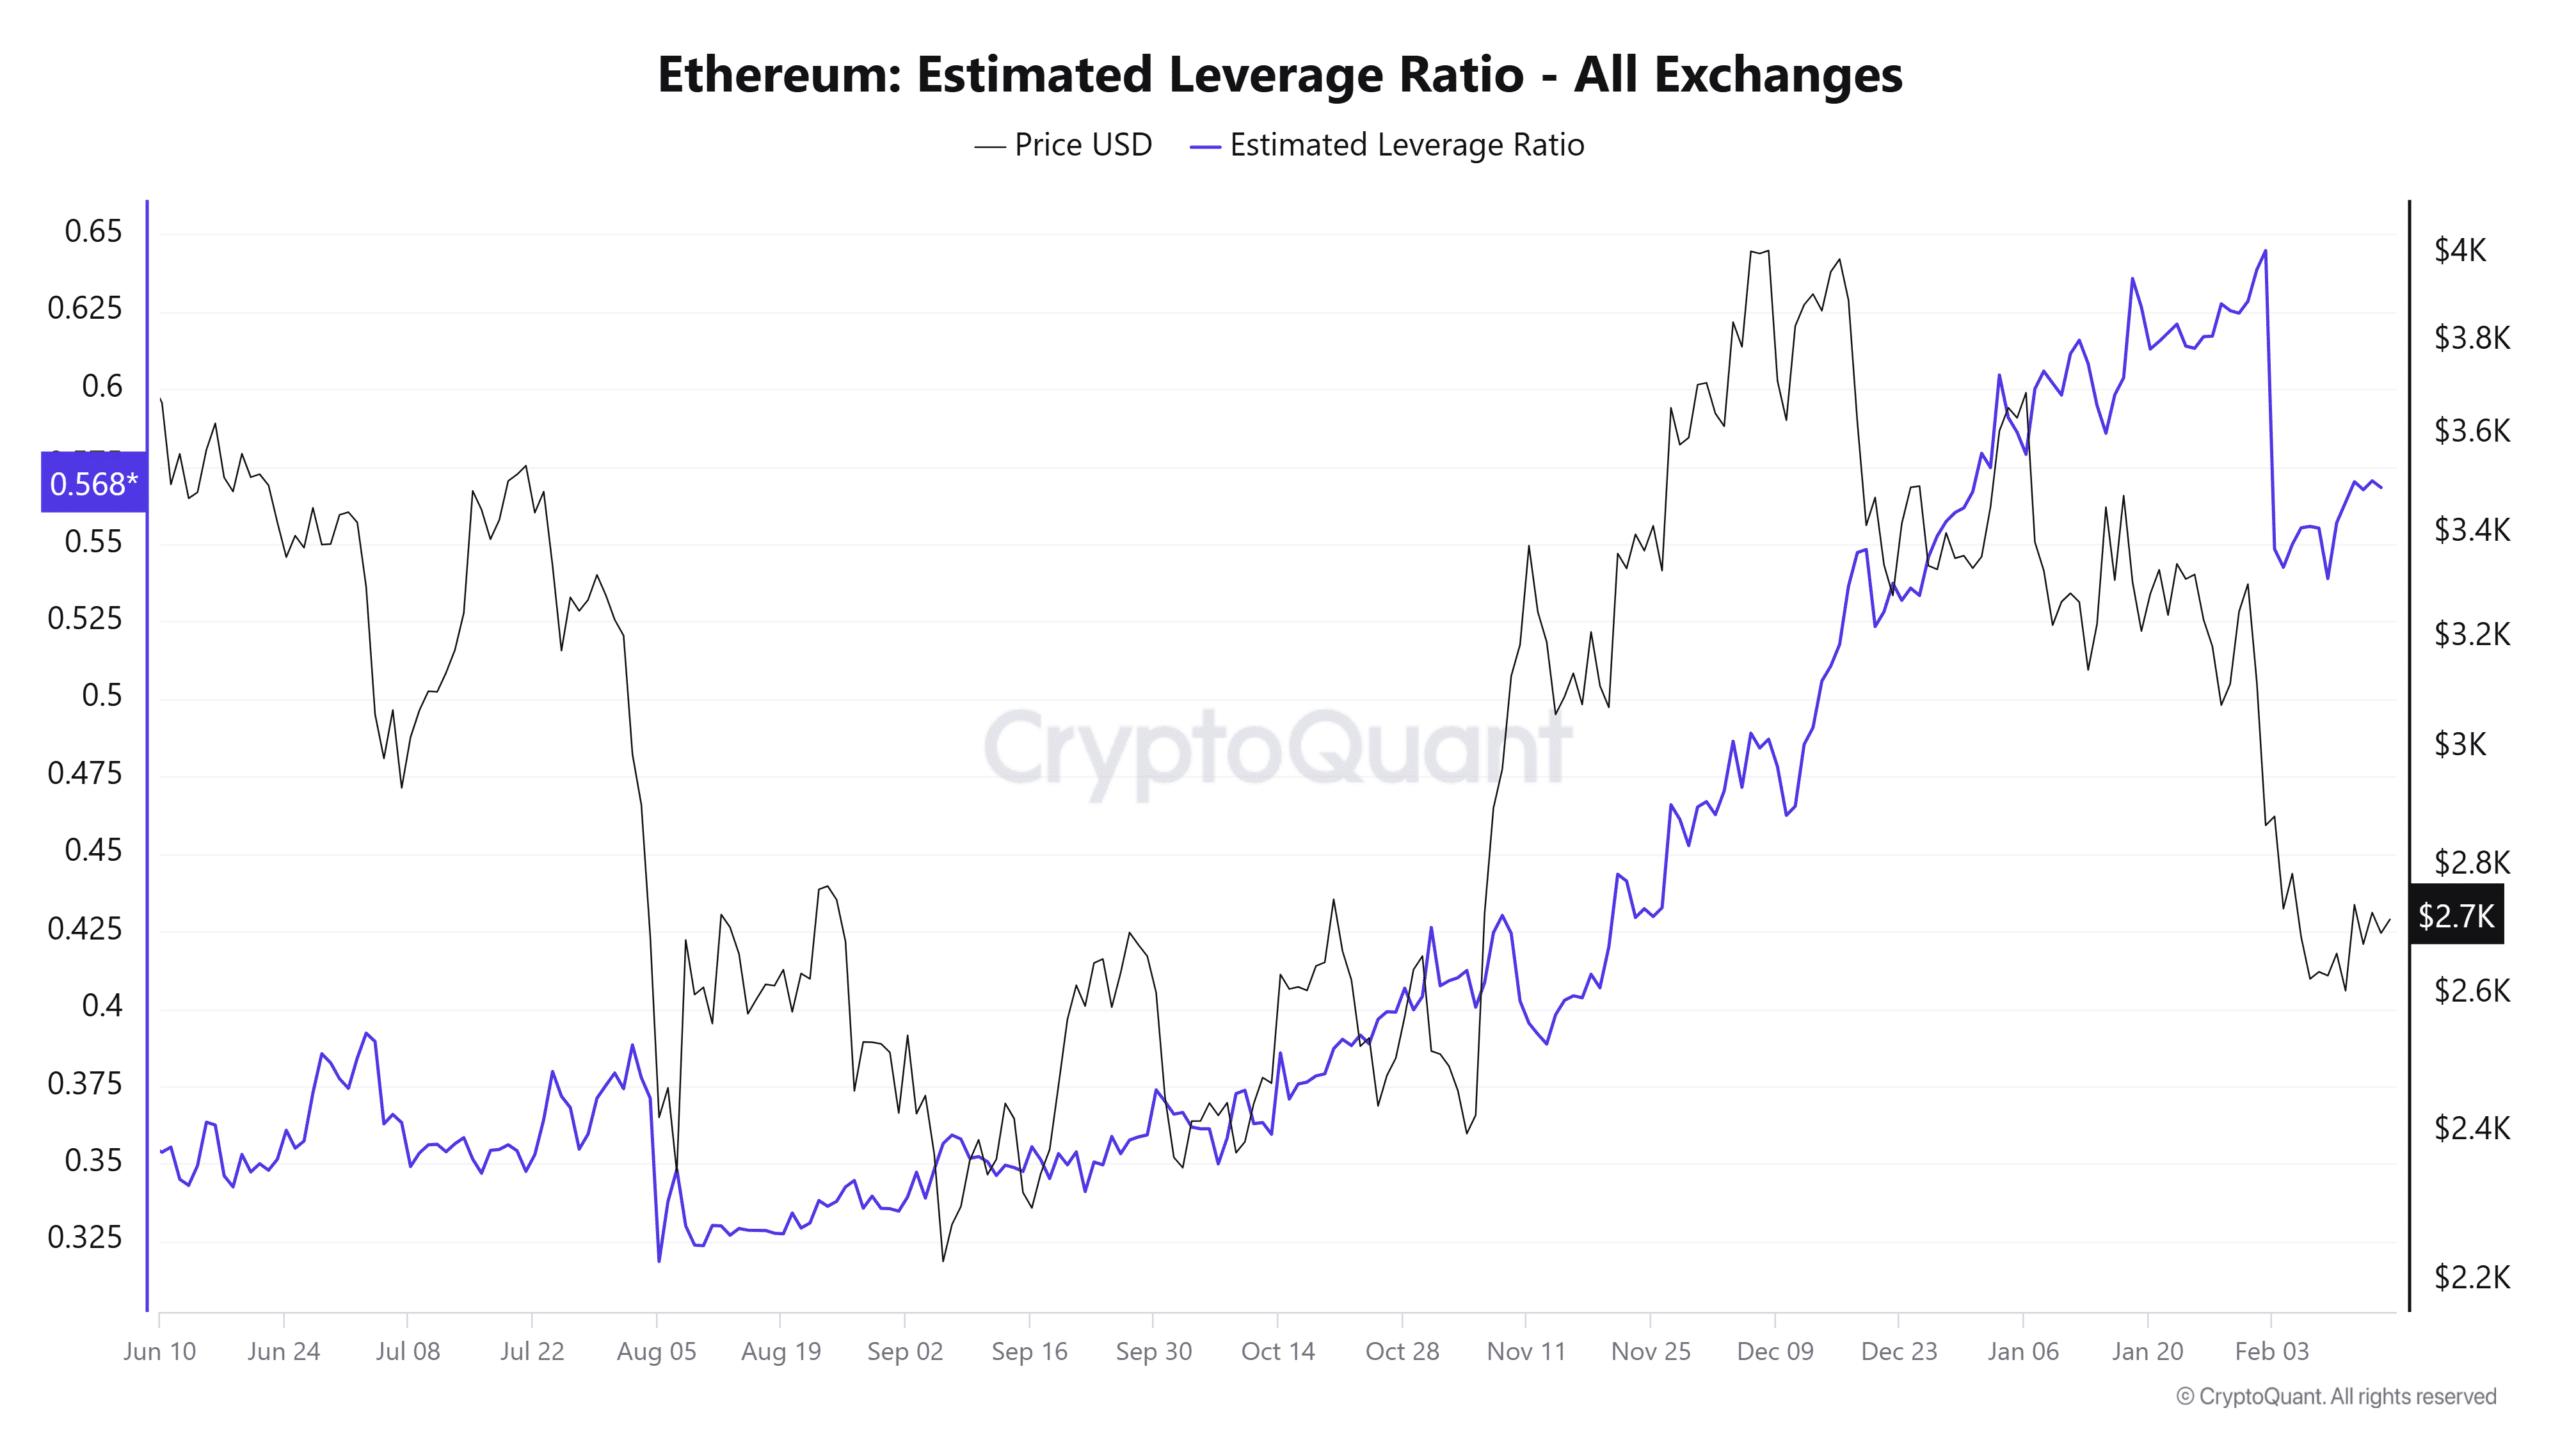
Source: CryptoQuant
The estimated leverage ratio (ELR) is determined by dividing the open interest of exchanges by their coin reserves.
This ratio acts as an indicator of market sentiment; a rising ELR typically suggests a willingness among traders to take on more risk, which can signify bullish market conditions.
A sharp decline in prices during early February interrupted the ELR’s upward momentum, although it has since seen an uptick.
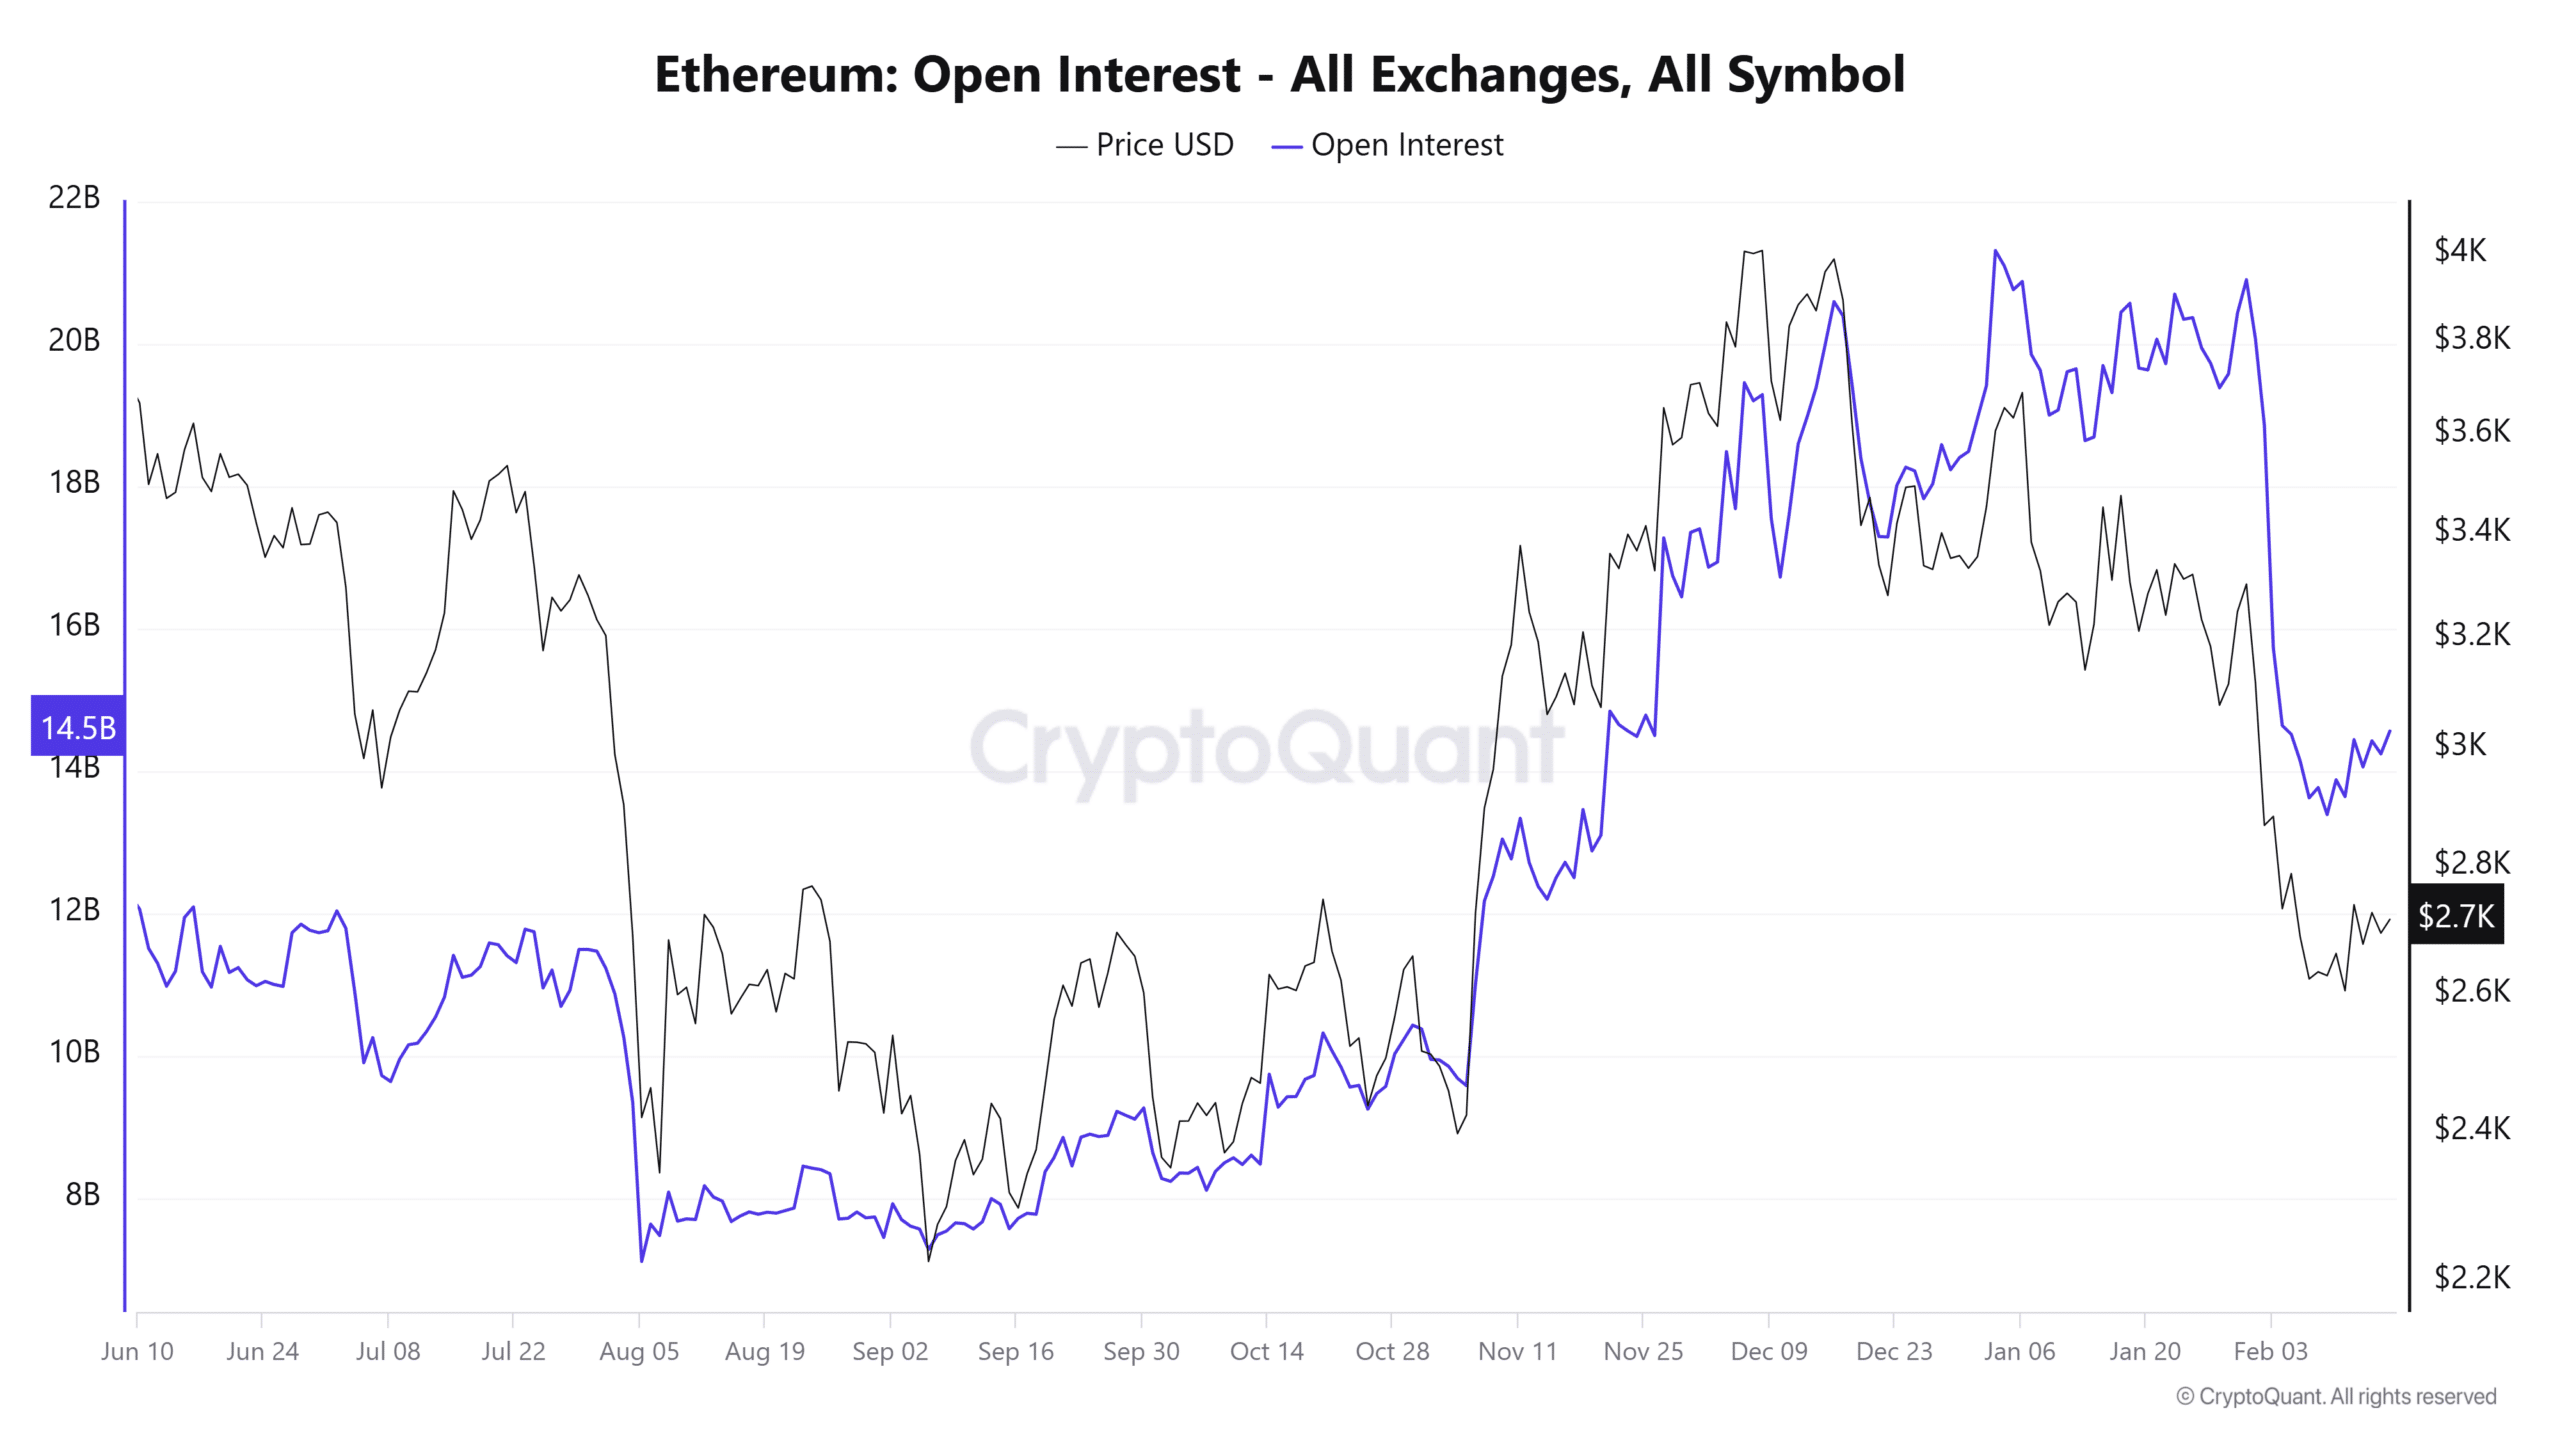
Source: CryptoQuant
Recently, open interest has shown an increase, rising from $13.3 billion to $14.2 billion, correlating with a price recovery from $2,500 to $2,700.

Source: CryptoQuant
There has been a significant outflow of ETH from exchanges in the past two weeks, indicating a bullish trend and suggesting accumulation. However, this alone does not guarantee a complete shift in price direction.
It’s essential to keep in mind that the ELR calculation involves dividing open interest by reserves, so an increase in open interest coupled with a decrease in reserves will raise the ELR.
Thus, one should cautiously interpret the ELR’s indication regarding speculative expectations. While short-term bullish signals based on open interest and ELR exist, they should be viewed with caution.

Source: Coinglass
The liquidation heatmap reveals a substantial liquidity cluster near the $2,800 level, extending to $2,880, indicating it may act as a major short-term magnet.
In addition, $3,500 stands as a long-term target significantly farther down the line.
As such, market participants should remain cautious of sudden price upticks.
If Ethereum breaks above $2,800—previously a major resistance level—it could incite positive sentiment and increase leveraged trading activity. However, a rise to $2,880 may serve as a bull trap before initiating a downward reversal.