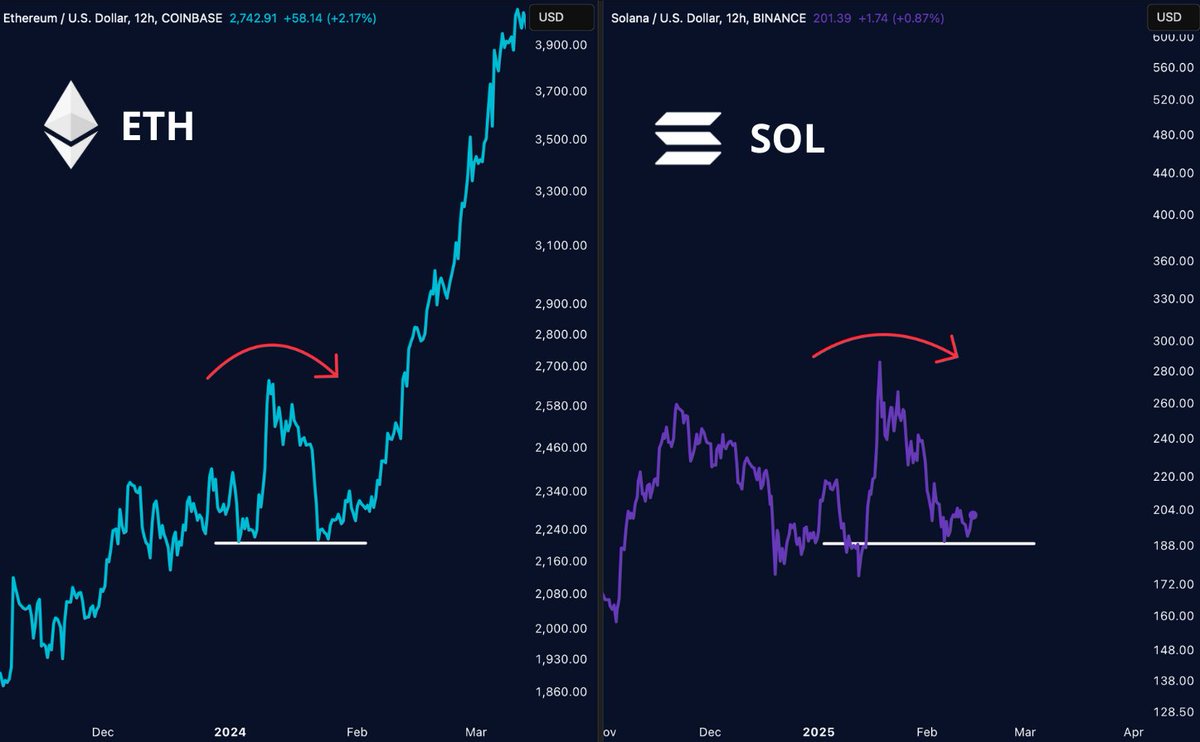
- Solana may be reflecting Ethereum’s anticipated breakout in 2024
- The daily chart suggests Solana is forming a double bottom pattern, hinting at a possible upward trend
The latest analysis from AMBCrypto on Solana (SOL) has uncovered a striking resemblance to Ethereum’s 2024 price explosion. In that period, Ethereum experienced a significant rally, climbing from $2,500 in December to $3,700 by March.
This upward movement was characterized by a bullish recovery following a double bottom formation on the charts between mid-January and early February. During that time, critical price thresholds were established at $2,400 and $2,800. In a similar vein, Solana appears to be demonstrating a possible bottoming pattern, currently stabilizing above the $190 mark.
The SOL chart suggests that its price movements are following a comparable breakout trajectory as Ethereum’s. If Solana replicates Ethereum’s significant rise, it could see its value soar by as much as 80%, potentially reaching $340.
It is essential to consider that while historical trends provide an optimistic perspective for Solana, varying market conditions or external economic influences could affect this forecast, potentially leading to fluctuations or a more tempered growth trajectory.
The correlations outlined here suggest promising opportunities for movement. However, market participants should also stay alert to potential divergences arising from the unique circumstances impacting each cryptocurrency.
Double Bottom Indicates Possible Reversal
Examining the double bottom pattern reveals two distinct lows around the $190 level, suggesting potential reversal points for SOL. This technical formation, often interpreted as a bullish sign, indicates that SOL might have found solid support within this price range following a downtrend.
The neckline of this pattern, represented by the resistance line near $210, is crucial for validating the trend reversal. If SOL can surpass this neckline, it may trigger a rally towards higher resistance levels around the $230 mark.
On the other hand, if Solana fails to break through the neckline, it may revert to retesting the support levels, risking further declines if these levels do not hold. An increase in trading volume could provide confirmation of the strength of the breakout.
A sustained movement above the $210 resistance would affirm this bullish scenario. Conversely, a drop below the $190 support may suggest a continuation of bearish sentiment.
Solana’s Path to Mainstream Adoption
In parallel, the Crypto Task Force’s collaboration with Jito Labs and Multicoin Capital to study staking options within Exchange Traded Products (ETPs) could democratize access to yield generation on Solana.
This initiative could attract institutional investors by providing them with a familiar investment option (ETPs) while utilizing the lucrative staking opportunities on Solana. This would enhance liquidity and stability, further ushering Solana into mainstream financial frameworks.


