Essential Insights
- Bitcoin’s value dipped below $90,000 on Tuesday, reaching its lowest point in three months and highlighting a downward trend following last month’s peak amidst economic uncertainties affecting investor confidence.
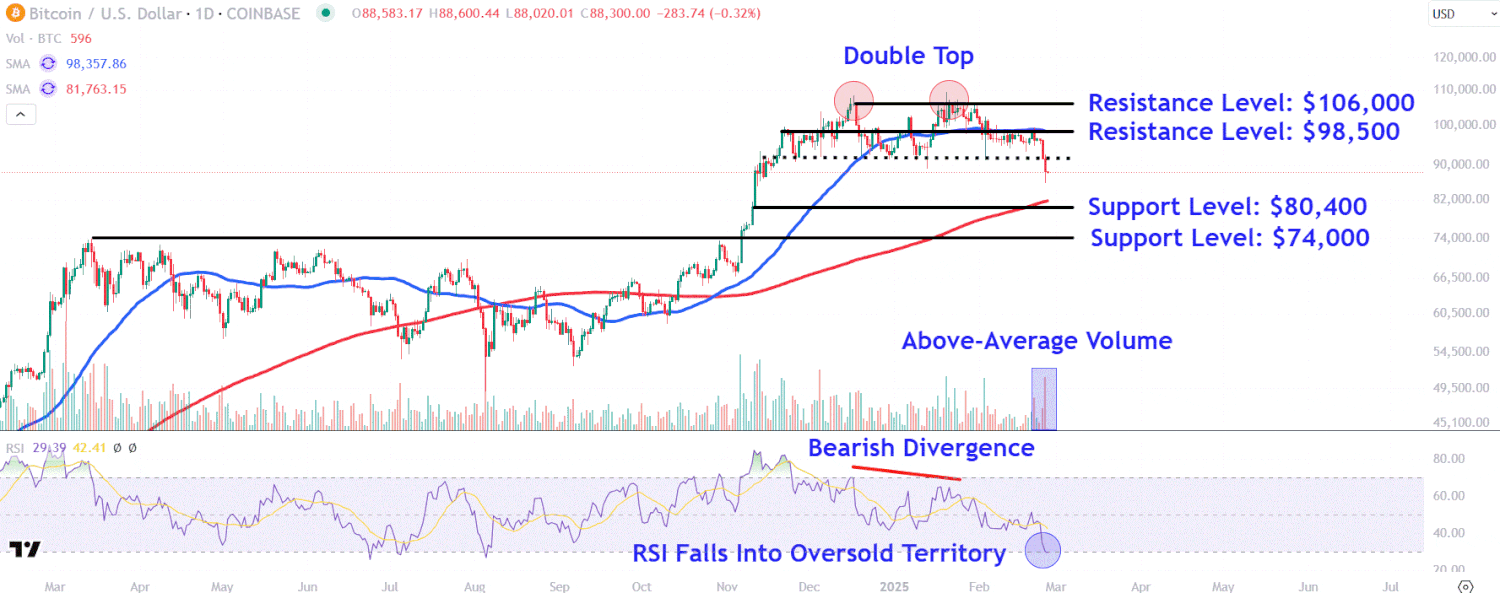
- The cryptocurrency has confirmed a breakdown below the neckline of a double top pattern during Tuesday’s session, marked by above-average trading volume.
- Key support levels to monitor on Bitcoin’s chart are around $80,400 and $74,000, while significant resistance levels are positioned near $98,500 and $106,000.
Bitcoin (BTCUSD) fell below $90,000 recently, continuing a decline from the all-time high reached last month as economic concerns impact market sentiment.
Earlier in the day, Bitcoin’s price dropped below $86,000 before recovering to around $89,000. The decline was influenced by news regarding the Trump administration’s tariffs on Mexico and Canada proceeding as scheduled. Investors generally perceive tariffs as inflationary, which may hinder potential interest rate cuts this year, impacting non-yielding assets like Bitcoin.
Historically, March has been a mixed month for Bitcoin, typically showing a balance of positive and negative returns from 2013 to the previous year, according to data from crypto analytics platform Coinglass. Thus far in 2023, Bitcoin has decreased by 5%, but remains up approximately 25% since the U.S. presidential election, fueled by expectations of favorable policies from the Trump administration and a supportive Congress for cryptocurrency.
Below, we delve deeper into Bitcoin’s chart, utilizing technical analysis to pinpoint significant price levels that require attention.
Breakdown of Double Top Pattern
Following the formation of two prominent peaks between December and January, Bitcoin’s value has trended downward, establishing a classic double top pattern. A clear breakdown beneath the neckline was confirmed with high trading volume during Tuesday’s session.
Notably, while the cryptocurrency achieved a marginally higher high last month, the relative strength index (RSI) displayed a comparatively lower high, indicating a bearish divergence, a technical signal of diminishing price strength.
Recent sell-offs have pushed the RSI indicator into oversold territory, suggesting the potential for short-term rebounds.
Let’s outline several important support and resistance levels on Bitcoin’s chart that investors should keep an eye on.
Significant Support Levels to Monitor
Further declines below the double top’s neckline may see movement towards the $80,400 level. This section on the chart is likely to serve as support, aligning with the 200-day moving average (MA) and the closing and opening prices of two significant candlesticks from an upward movement in mid-November.
The next notable support level to observe is around $74,000, which investors may consider a buying opportunity due to its alignment with a horizontal line connecting multiple notable peaks on the chart spanning from March to October of last year.
Important Resistance Levels to Keep an Eye On
Should the cryptocurrency manage to breach the double top’s neckline, we could see a rise to the $98,500 mark, which may act as resistance correlated with the respected 50-day MA, currently aligned with similar trading levels from late November.
Finally, a close above this zone could trigger a retest of the $106,000 level. Investors who have averaged down may consider this area to realize profits near the peaks of the double top pattern.
The views and analyses provided on this site are intended for informational purposes only. For more details, please read our disclaimer regarding warranties and liabilities.


