Key Insights
- The stock of Intel is expected to stay on the radar for investors this Tuesday, following a report indicating that Broadcom and Taiwan Semiconductor Manufacturing Co. are exploring offers for segments of the company.
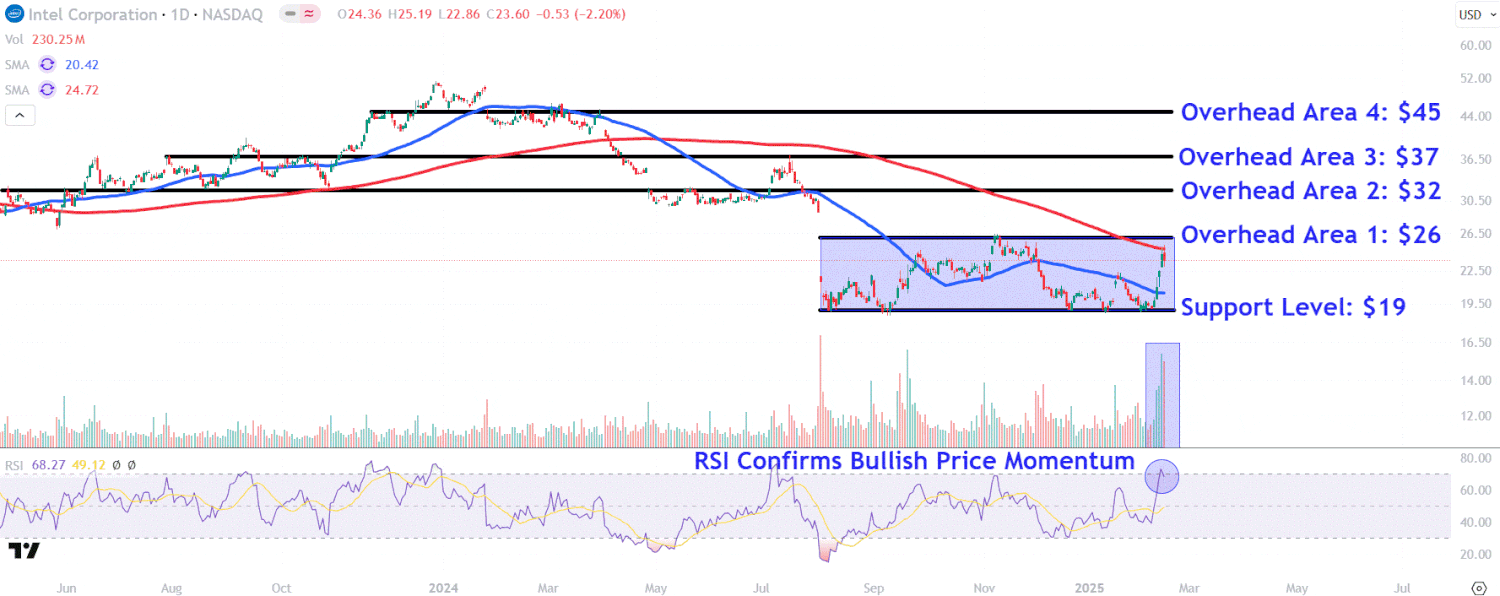
- Since experiencing a marked decline in early August of the previous year, Intel’s stock has fluctuated within a narrow range, potentially forming a rectangle bottoming pattern.
- The relative strength index (RSI) is currently just below the 70 mark, signaling bullish momentum and suggesting the likelihood of continued positive price movements this week.
- Investors should monitor critical resistance levels on Intel’s chart at $26, $32, $37, and $45, along with a significant support zone around $19.
Intel’s shares (INTC) are likely to remain a focus for investors this Tuesday. A recent article from The Wall Street Journal detailed that Broadcom (AVGO) and Taiwan Semiconductor Manufacturing Co. (TSM) are considering bids for parts of the troubled chipmaker.
The article further indicates that Broadcom is interested in Intel’s chip-design and marketing division, while TSMC is contemplating acquiring some or all of Intel’s fabrication facilities, possibly through an investor consortium or alternative arrangements.
Intel shares rose by over 20% last week after Vice President JD Vance announced at a recent AI conference in Paris that the Trump administration would implement measures to ensure the design and production of AI chips occur in the U.S., a development likely to benefit Intel’s foundry sector that manufactures chips for external clients.
Positive sentiment around the stock was further fueled by speculations regarding a potential partnership with TSMC for chip fabrication in the U.S. However, despite the significant gains last week, Intel shares have declined by nearly 50% over the past year due to concerns surrounding the company’s unclear turnaround strategy and its struggle to capture a larger share of the lucrative AI silicon market.
Below, we dive deeper into Intel’s stock chart and employ technical analysis to identify crucial price points of interest for investors.
Potential Rectangle Pattern Development
Since experiencing a sharp downturn in early August of last year, Intel shares have predominantly been trading within a range, potentially forming a rectangle bottoming formation.
This month, the stock has surged toward the upper limit of this trading range, buoyed by above-average trading volume, although the 200-day moving average (MA) has acted as resistance in recent sessions.
Currently, the relative strength index (RSI) hovers just below 70, indicating strong bullish momentum and propelling the likelihood of sustained positive price movements in the coming week.
We will pinpoint four significant overhead levels on Intel’s chart where selling pressure could arise, as well as highlight a crucial support level to watch if the stock experiences a downturn.
Key Resistance Levels to Monitor
First, it’s important to observe the $26 level. This price point, currently positioned above the 200-day MA, may present resistance near the upper trendline of the rectangle pattern.
A clear breakout above this mark could lead the shares to approximately $32. Investors who acquired shares at lower levels might seek profit-taking opportunities in this vicinity that connects various trading levels from April 2023 to July of the previous year.
Surpassing this level could catalyze a rise toward the $37 mark. There, shares may encounter resistance near a horizontal line that connects multiple peaks from August 2023 and last July.
In a positive trend, the stock could rise to around $45, an area where investors might look to secure profits based on a series of peaks and troughs that occurred on the chart between November 2023 and March 2024.
Critical Support Level to Observe
Should Intel’s stock price dip, investors should pay close attention to the $19 level. This point on the chart is likely to offer substantial support, where buyers might seek entry opportunities along the lower trendline of the rectangle pattern.
The views, insights, and analyses shared on Investopedia are intended solely for informational purposes. Consult our warranty and liability disclaimer for more details.
As of the date of this article’s publication, the author does not hold any of the securities mentioned above.


