


- The strong support level at $95,000 attracted a multitude of traders, resulting in upward trends during subsequent tests.
- The net volume of taker orders decreased significantly, as the Funding Rate remained steadily positive.
Bitcoin (BTC) trading activity reflects a notable spike in trader participation, particularly identifying the $95,000 mark as a crucial support level. This price point saw a large number of traders entering the market.
This critical zone has consistently triggered upward movements on the charts following retests, affirming its status as a robust support area. As of now, Bitcoin is trading at approximately $97,505, marking a slight increase of +0.19%.

Source: Hyblock Capital
This analysis indicates that after confirming support, Bitcoin’s price may continue to rise. Nevertheless, the future price movements will hinge on market fluctuations and traders’ reactions at these critical levels.
The observations provided may offer traders valuable insights into potential resistance and support zones, along with their implications for price trends.
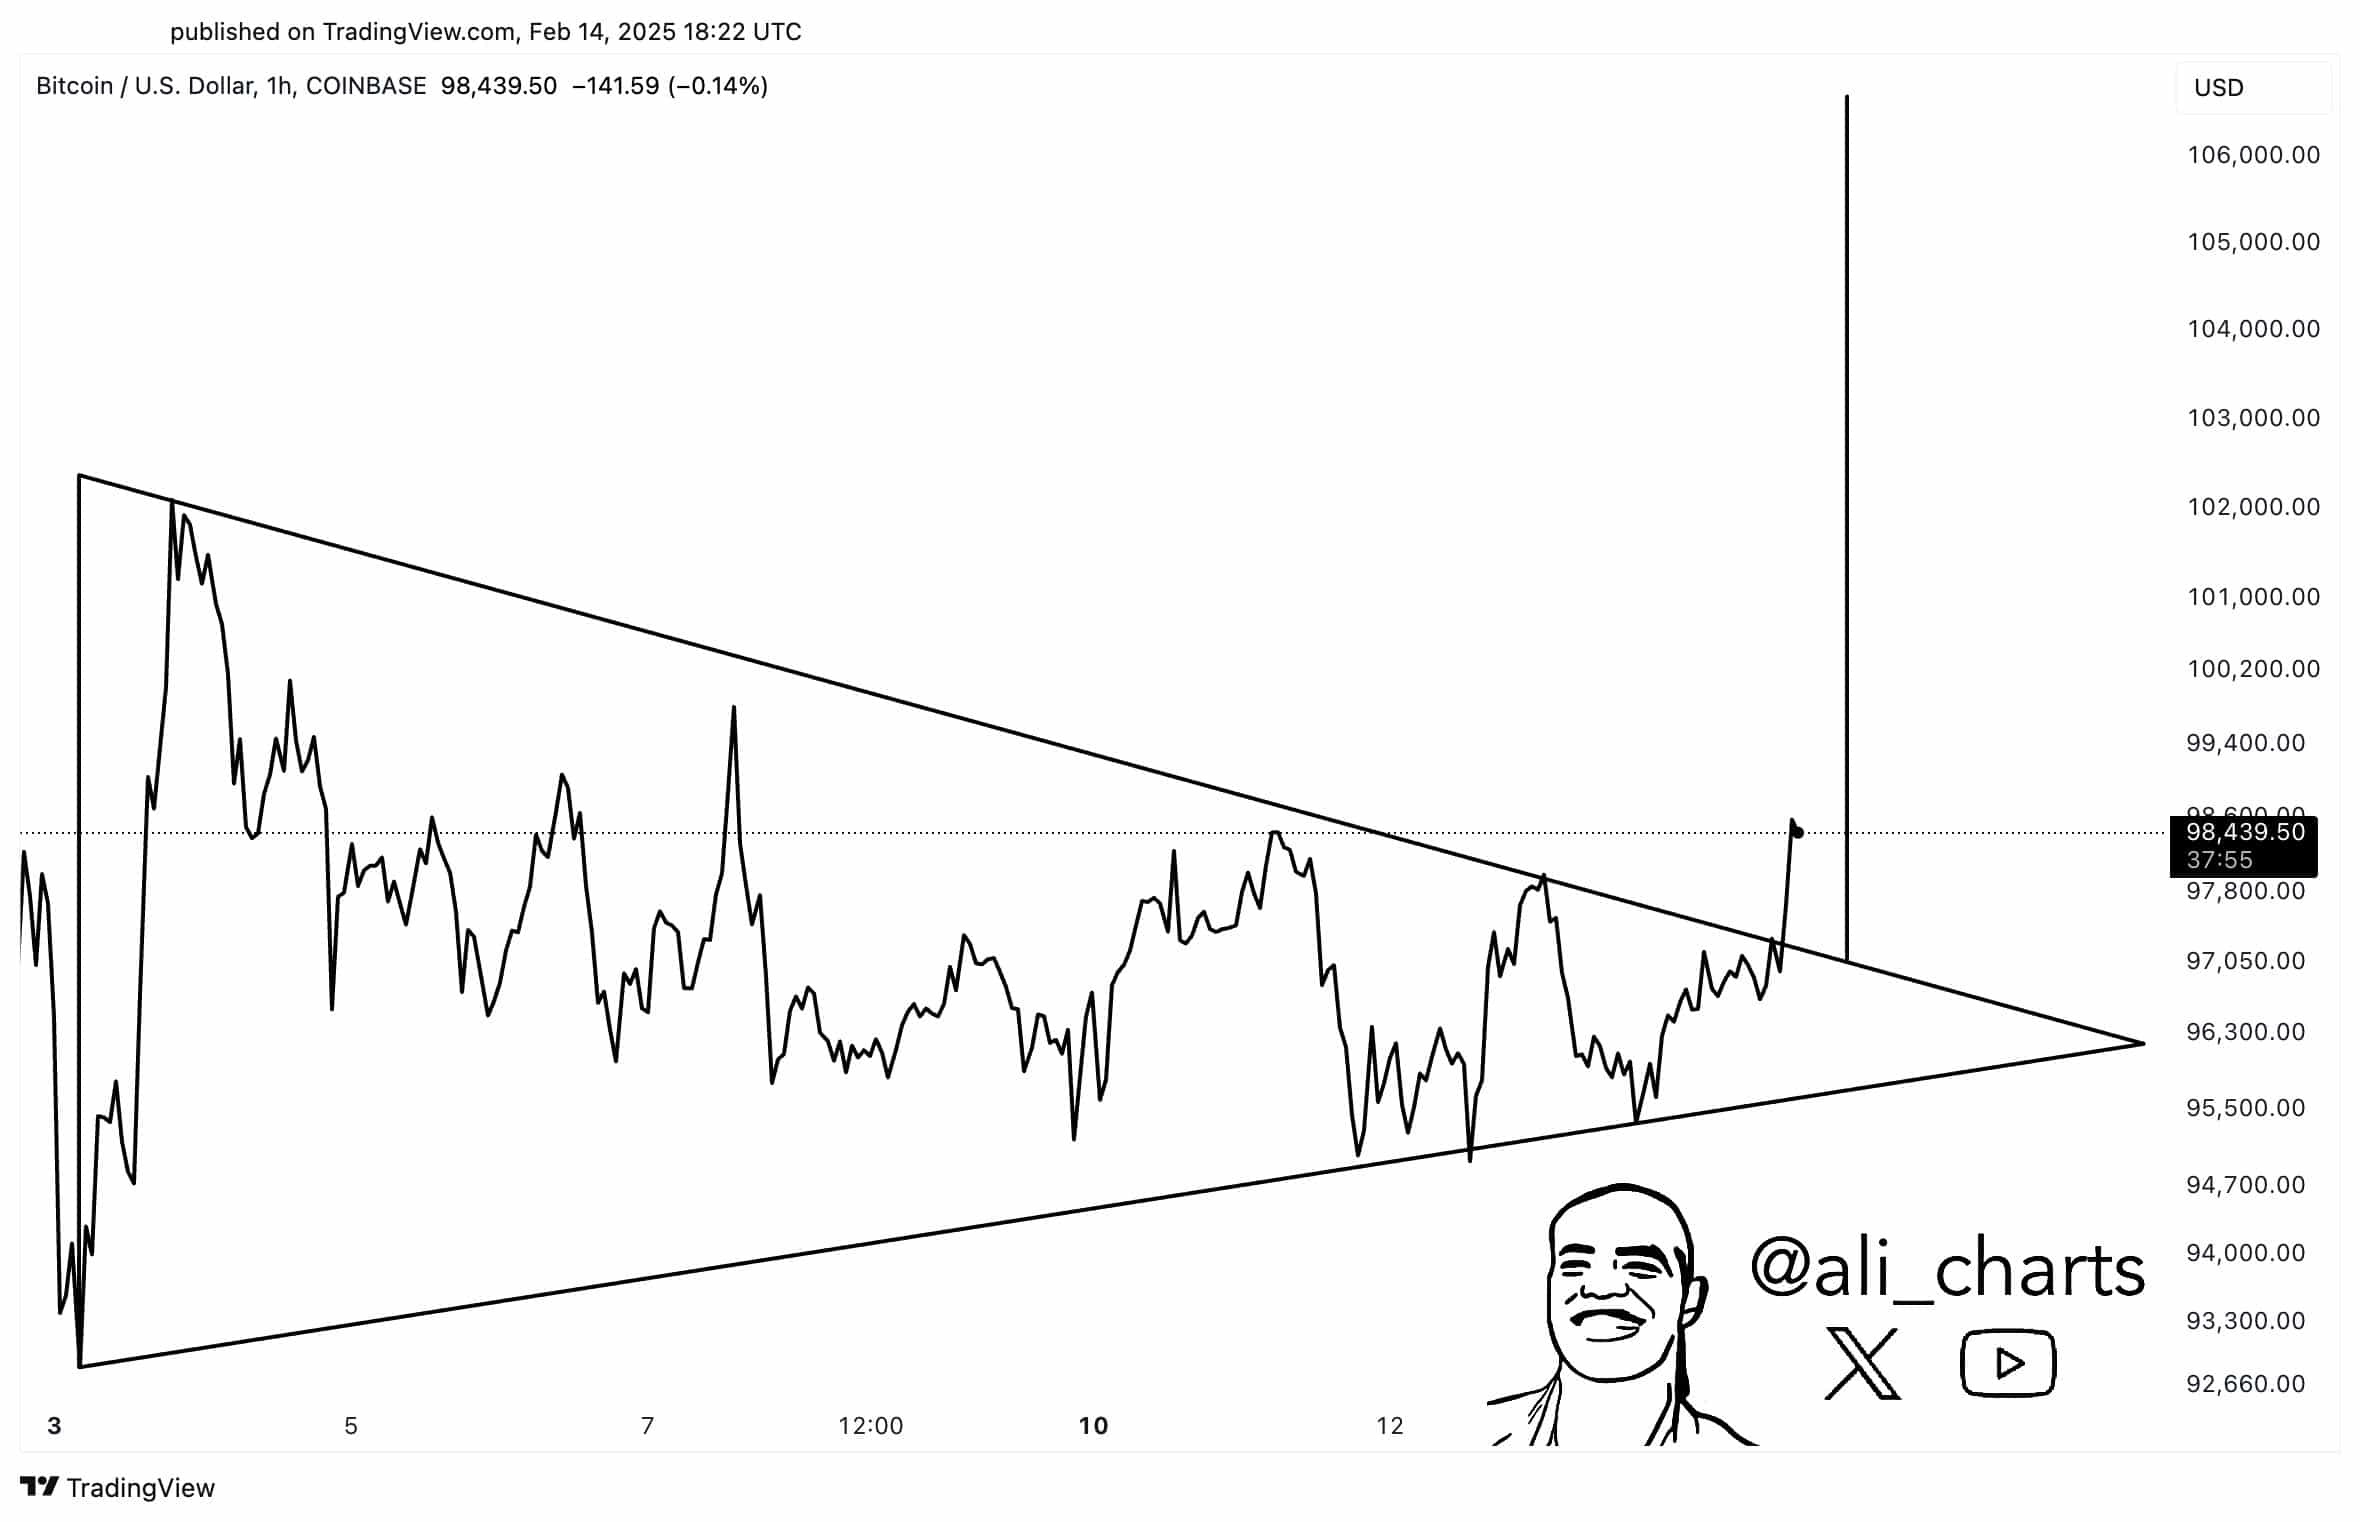
Bitcoin’s Symmetrical Triangle Breakout
Following this upward rally, Bitcoin experienced a breakout from a symmetrical triangle formation. The breakout drove the price up to $98,439.50. Although the symmetrical triangle suggested uncertainty, it tends to resolve in the direction of the prevailing trend, which in this instance has been bullish.
Bitcoin first tested the lower boundary of the triangle and then rebounded above the upper boundary, indicating resistance testing around $99,000. A successful breakout above this threshold could indicate a continuation of the bullish trend and challenge the $100,000 milestone.
Source: Ali/X
On the other hand, a drop below the triangle’s support level near $95,500 could prompt a retest of lower support levels around $92,660 or even further down.
Analysis of Taker Volume and Funding Rate
In the last two weeks, there has been a substantial decline in net taker volume, indicating fewer aggressive market entries, particularly for short positions. This trend corresponds with a consistently positive funding rate, suggesting that traders holding long positions are willing to incur costs to maintain their positions, likely in anticipation of price increases.
Throughout this period, Bitcoin’s price demonstrated stability, hovering around the $99,000 mark. This stability, paired with reduced short selling and favorable funding rates, may indicate inherent strength within the market.

Source: CryptoQuant
The increase in open interest suggests that engagement is on the rise, despite the price stagnation, hinting at a potential buildup for a future breakout. Considering these aspects, the outlook for Bitcoin appears cautiously optimistic.
If trader participation continues to grow without a simultaneous uptick in short selling, Bitcoin may test higher resistance levels. Conversely, a sharp increase in short positions or a negative shift in funding rates could drive the price downward.