


- Bitcoin appears to be consolidating below the $101,900 mark, creating a symmetrical triangle indicative of a possible breakout or reversal.
- The NVT Golden Cross alongside the Taker Buy/Sell Ratio indicates potential overbought scenarios and moderate buying momentum.
Bitcoin (BTC) is currently testing pivotal support levels, with investors keenly observing for potential breakout signals or a price pullback. Trading at $97,183, the leading cryptocurrency has risen by nearly 1% in the past 24 hours.
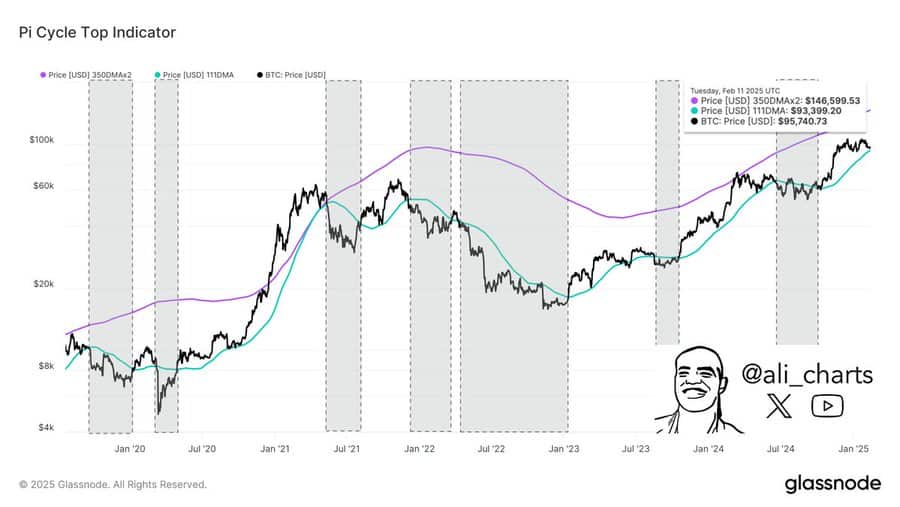
On the charts, the $93,400 mark is highlighted by the 111-day moving average, which has historically acted as a significant support level. The market’s response to this level could be crucial in determining Bitcoin’s next direction. Will it maintain its ground, or could it be gearing up for another upward push?
Source: X
What Lies Ahead for Bitcoin’s Price?
Currently, Bitcoin is consolidating beneath the resistance level of $101,900. Despite several attempts to breach this barrier, it has struggled to sustain trading above it recently, leading to the formation of a symmetrical triangle—a chart pattern that typically signifies a major price movement.
If Bitcoin successfully breaks above $101,900, it could surge swiftly toward higher resistance points, potentially igniting another rally.
Conversely, failing to surpass this resistance level could result in a downward correction, retesting the support zones at $93,400 and $97,170. Traders should closely monitor these levels for indications of a breakout or reversal.
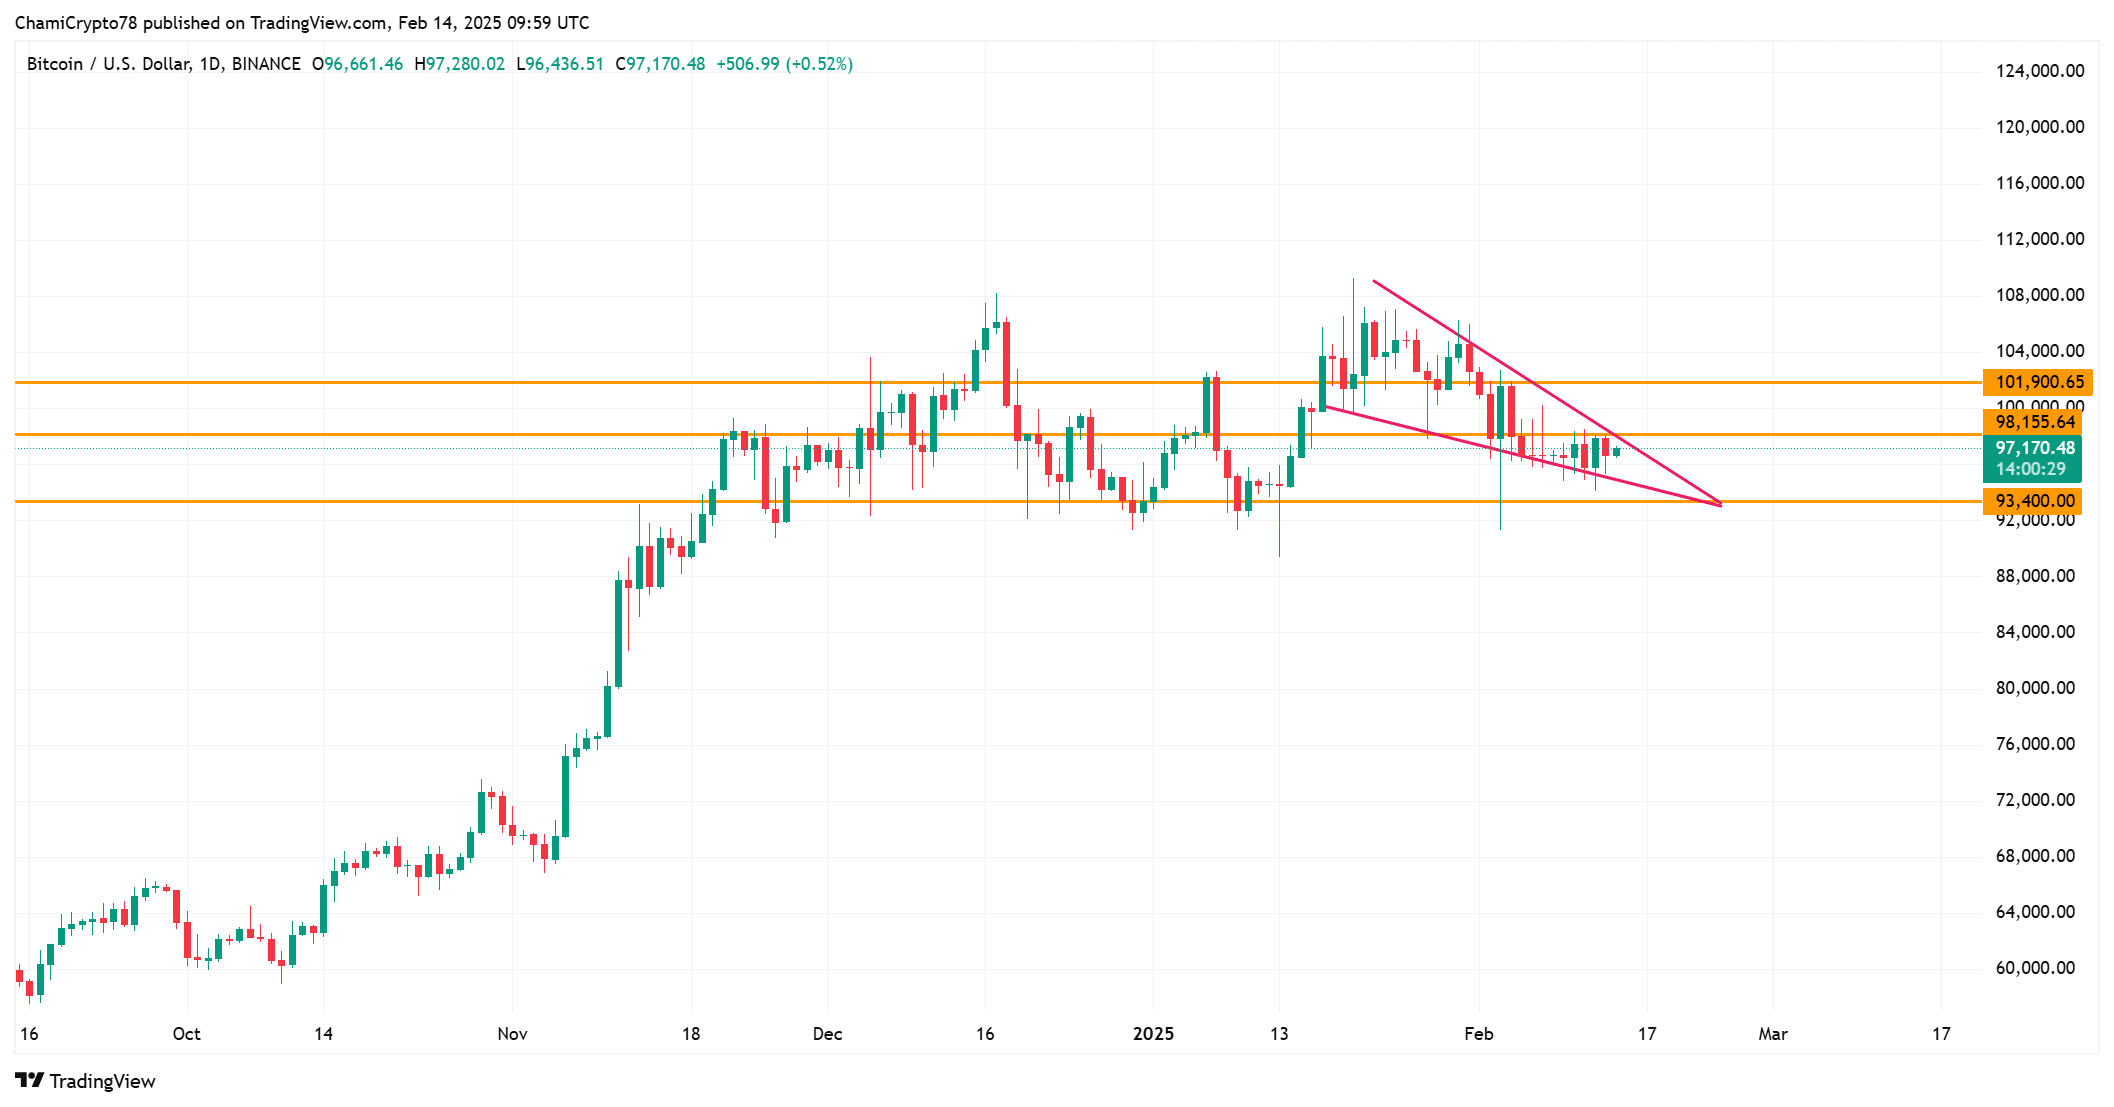
Source: TradingView
NVT Golden Cross – Should Traders Exercise Caution?
The NVT Golden Cross indicator for Bitcoin has surged by 28.21% in the last 24 hours, according to CryptoQuant analytics. This increase suggests that Bitcoin may be entering overbought territory, particularly as the NVT values have surpassed 2.2.
Historically, such high levels have often indicated local price peaks, which could precede corrections.
Nevertheless, if demand remains robust, Bitcoin might sustain its bullish trend. Therefore, this indicator alone may not suffice to forecast an immediate reversal. While vigilance is essential, Bitcoin could continue its ascent depending on market strength.
Taker Buy/Sell Ratio – Is There Increasing Buying Pressure?
The Taker Buy/Sell Ratio has experienced a 0.95% rise in the last 24 hours, indicating a slight increase in buying pressure. Although the ratio remains below 1, it suggests that buying activity is outpacing selling.
Should this trend persist, Bitcoin may experience upward momentum on the chart. However, a surge in selling pressure could prompt a reversal, once again testing key support levels. Consequently, market sentiment will be instrumental in guiding Bitcoin’s future trajectory.
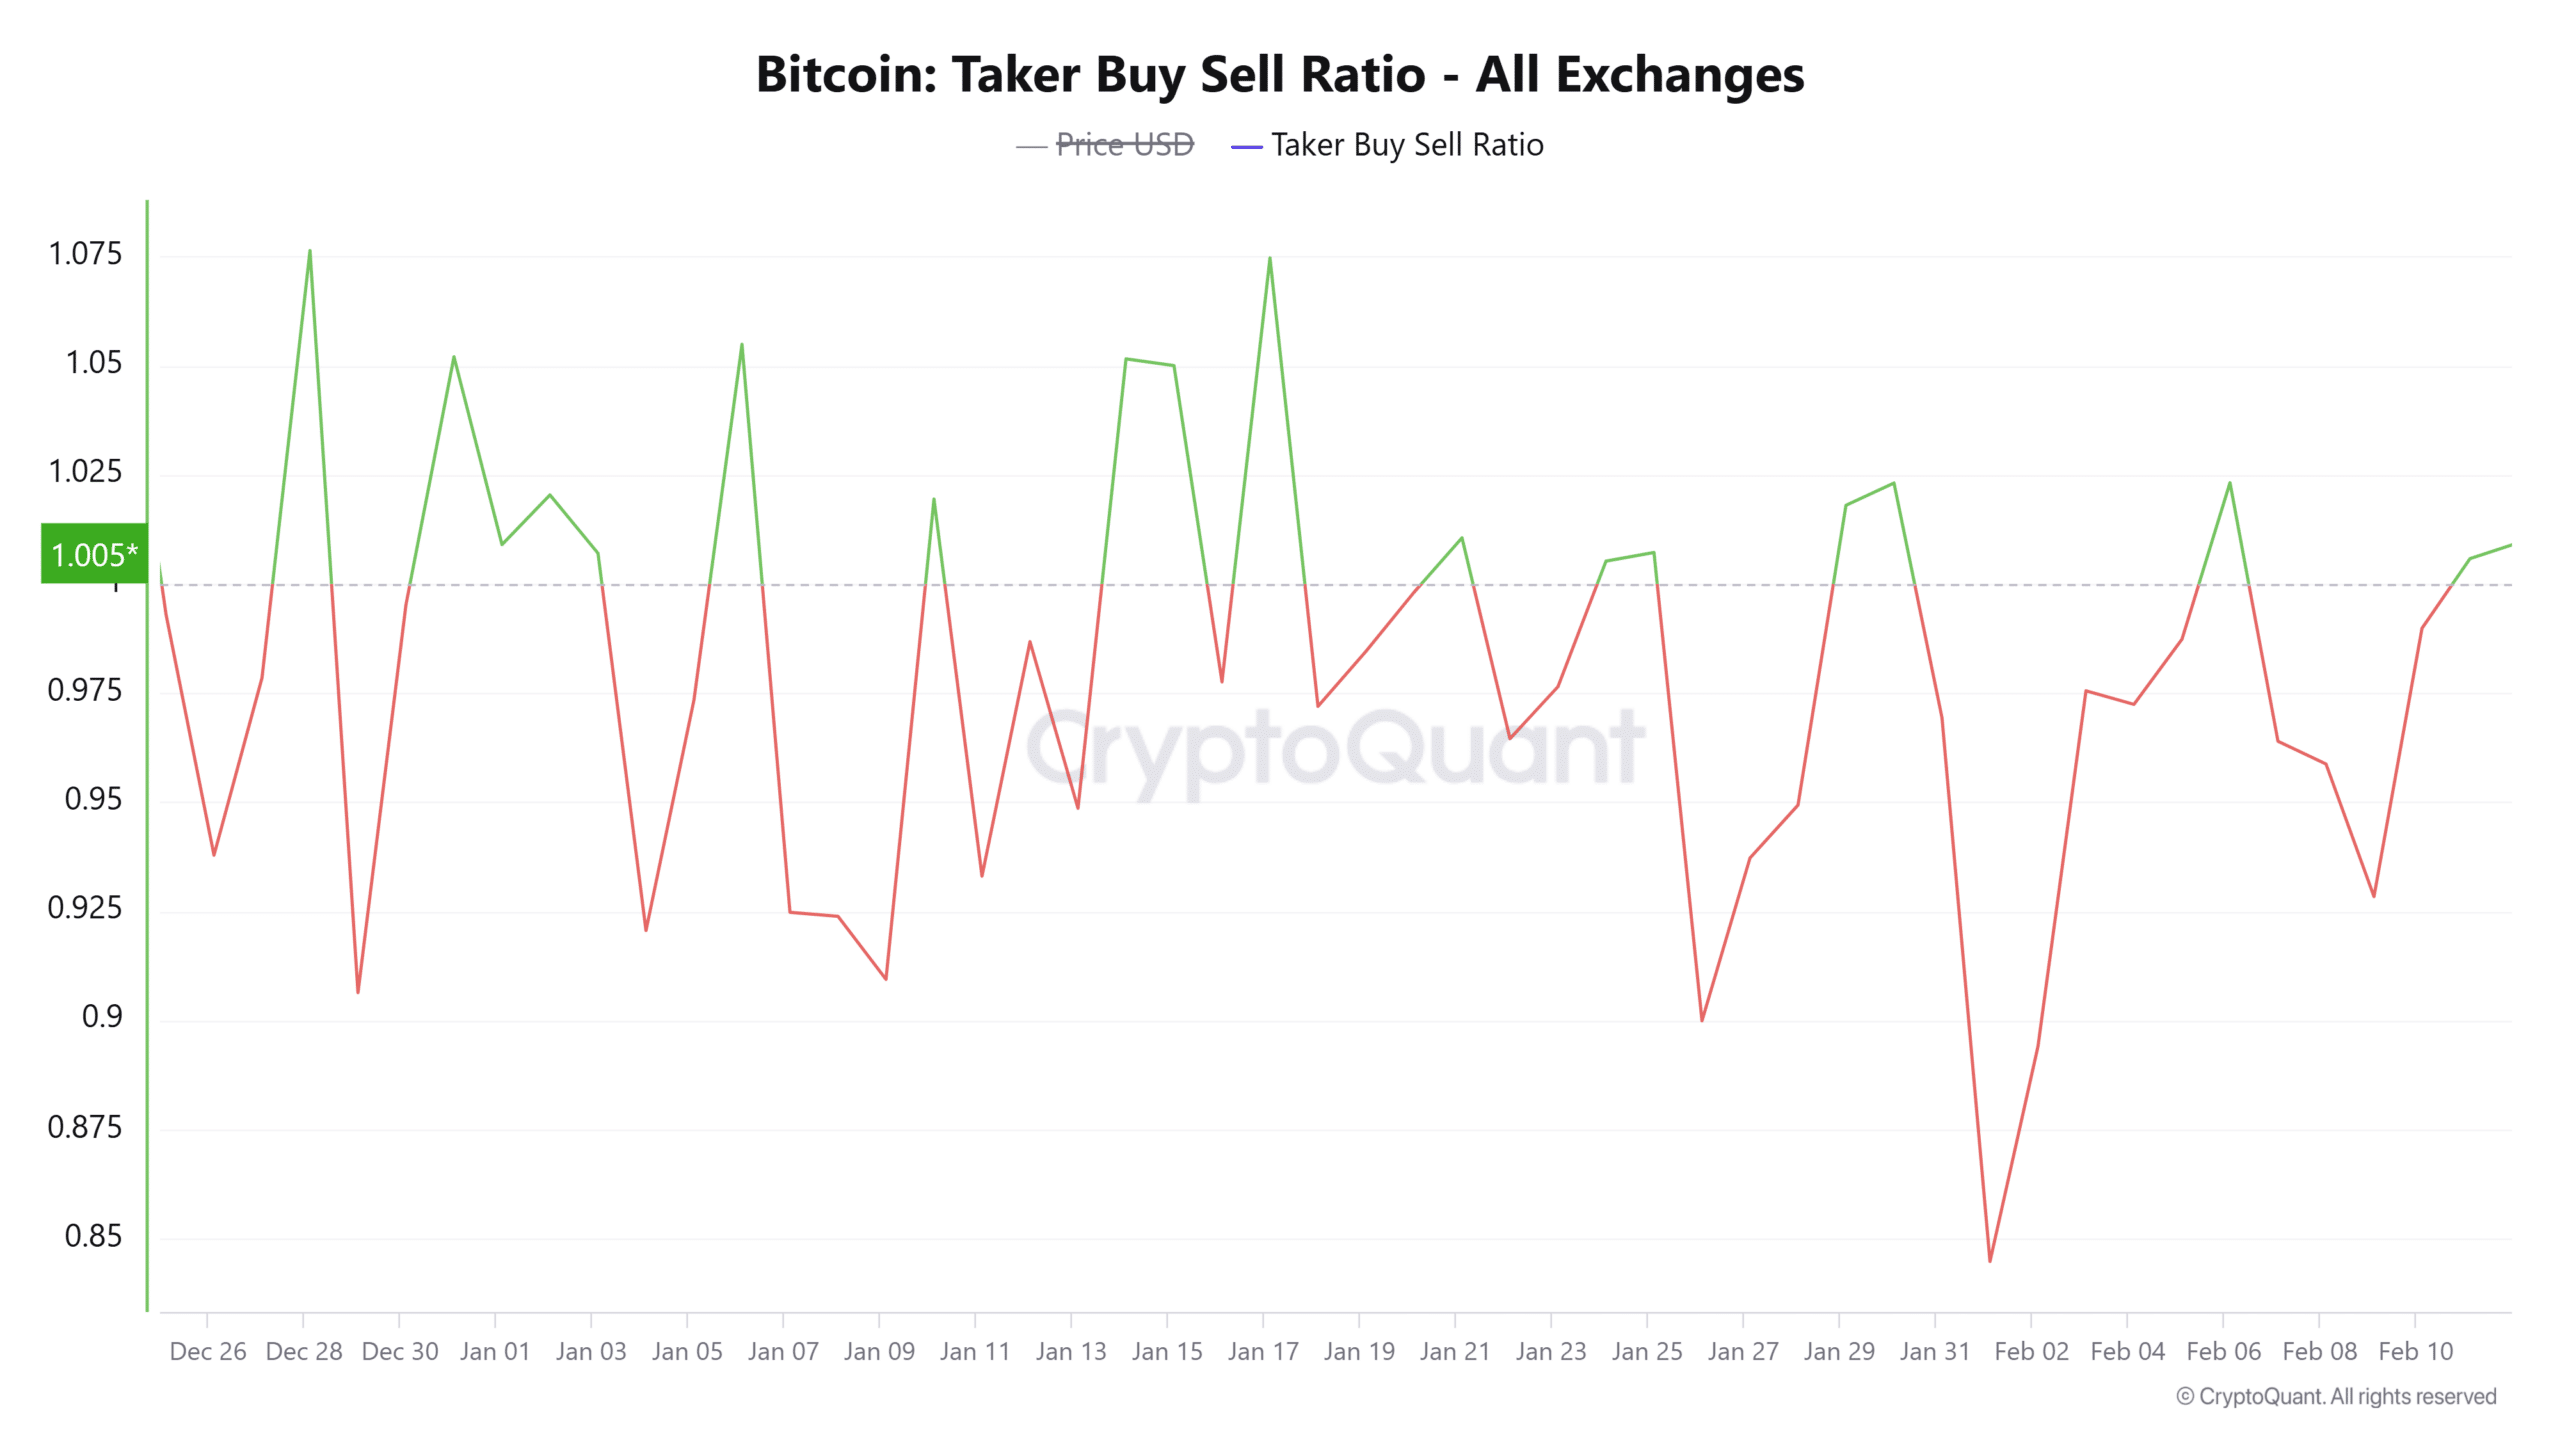
Source: CryptoQuant
Insights from Liquidations
Current liquidation heatmap data indicates a substantial concentration of liquidations around the $93,400 support area and the $97,170 resistance point. Should Bitcoin decline further, an acceleration of liquidations may occur, potentially triggering a rebound.
Conversely, if Bitcoin can breach the $97,170 resistance level, it may unleash long liquidations, applying upward pressure on prices.
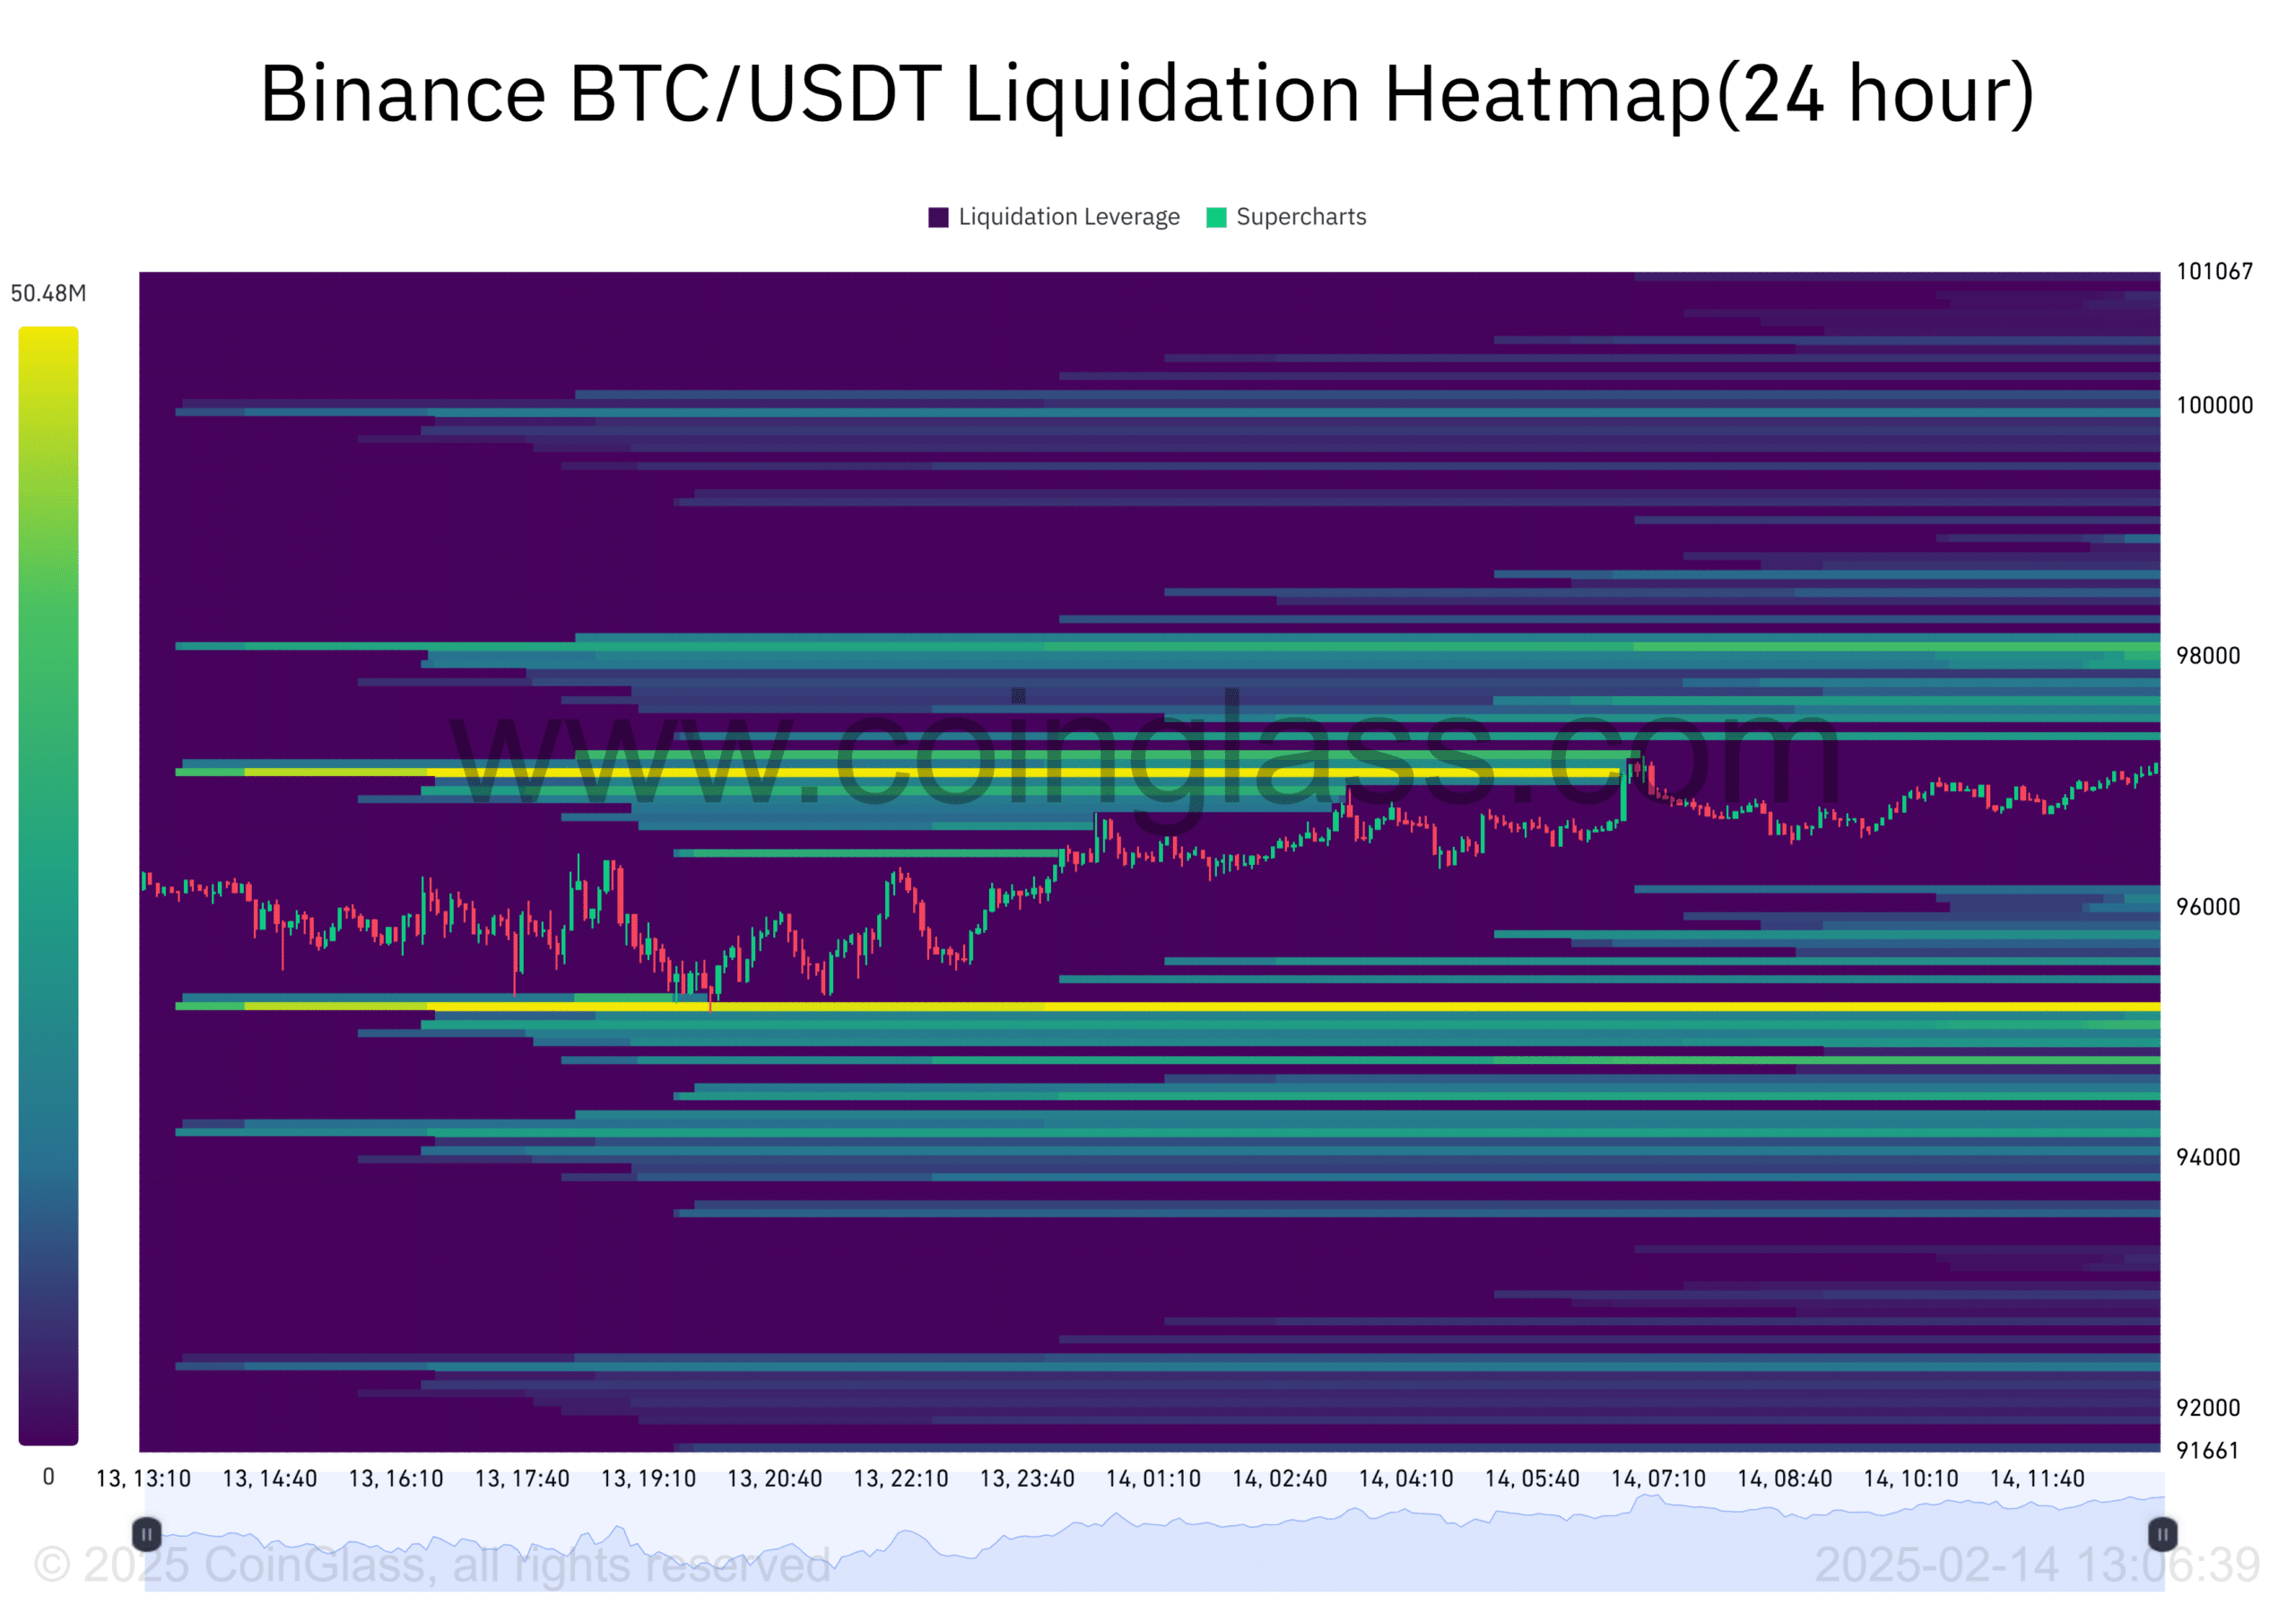
Source: Coinglass
At the moment, Bitcoin is trading near the significant level around $97,170. Multiple indicators suggest that volatility is on the horizon as the NVT Golden Cross warns of overbought conditions, while the Taker Buy/Sell Ratio reflects moderate buying pressure.
Taking into account the liquidation heatmap and prevailing market conditions, Bitcoin is likely to test its support soon, which could lead to a rebound or breakout thereafter.