Key Insights
- GameStop’s stock jumped nearly 8% in after-hours trading on Thursday after news emerged that the iconic game retailer, which became popular as a meme stock, is contemplating an investment in Bitcoin and other cryptocurrencies.
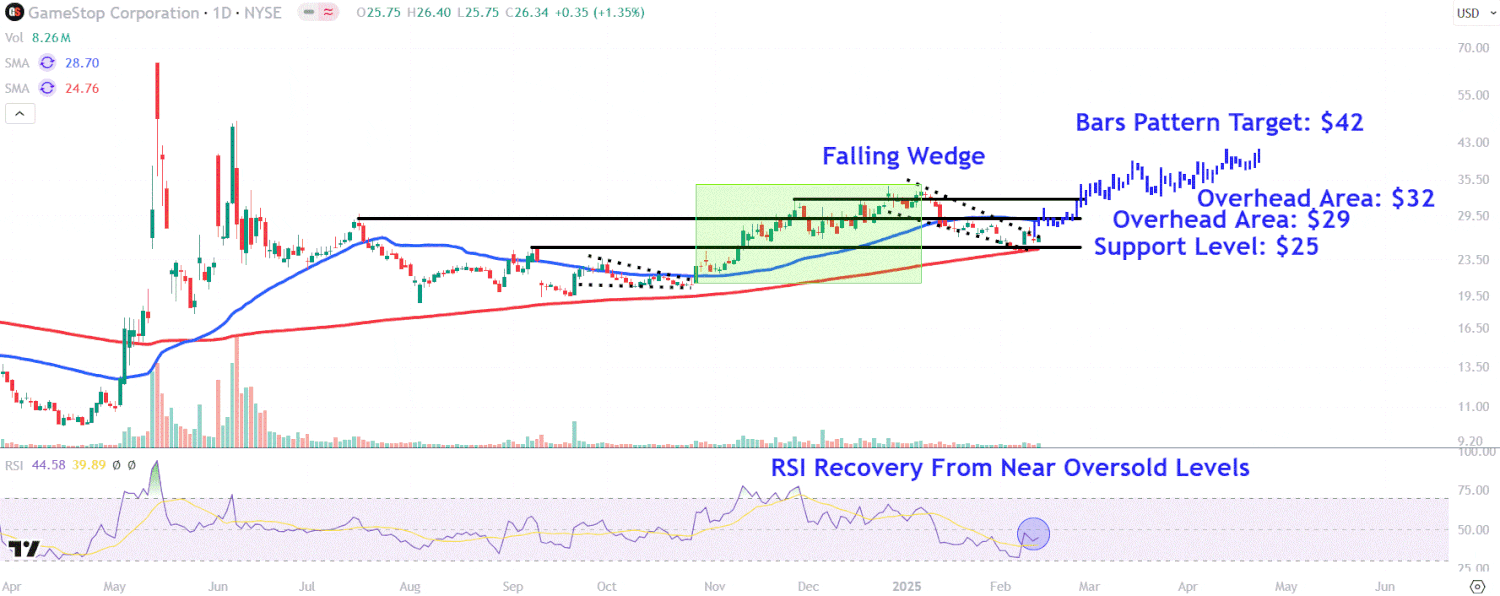
- The stock appears on the verge of breaching a falling wedge pattern in the upcoming Friday trading session, indicating a potential upward movement.
- Investors are advised to monitor significant resistance levels on GameStop’s chart at $29, $32, and $42, while keeping an eye on a crucial support point around $25.
GameStop (GME) shares surged nearly 8% in extended trading on Thursday, driven by speculation that the traditional video game retailer—now a viral meme stock—is considering investing in Bitcoin (BTCUSD) and various other cryptocurrencies.
According to reports from CNBC, the company is evaluating the possibility of diversifying into alternative asset classes, including cryptocurrency.
The speculation follows a recent post by GameStop CEO Ryan Cohen, who shared a picture with Michael Saylor, co-founder of MicroStrategy (MSTR), which is the largest corporate holder of Bitcoin. Notably, Saylor is not currently involved in GameStop’s discussions regarding crypto investments, as reported by CNBC.
GameStop shares, which previously experienced meteoric rises during the meme stock trading bonanza of the pandemic, have declined 16% since the beginning of the year. However, they have appreciated over 85% in the past 12 months, partially due to social media influencer “Roaring Kitty,” also known as Keith Gill, sparking renewed interest in the stock.
Below, we analyze the chart of GameStop and highlight essential price points for investors to consider.
Falling Wedge Breakout
Since reaching a seven-month high in early January, GameStop shares have consolidated within a falling wedge pattern. This chart formation suggests that once a breakout occurs above the upper trendline, a price increase is likely.
A breakout seems imminent for Friday’s trading session following the news of potential cryptocurrency ventures.
Additionally, although the relative strength index (RSI) is currently below 50, it has improved from previous oversold conditions earlier in the month, indicating a rise in price momentum.
Let’s take a closer look at significant price levels that could play a role during potential upward movements, as well as an important support level to track during pullbacks.
Key Resistance Levels to Monitor
To start, investors should be aware of the $29 mark, which may encounter selling pressure due to a horizontal line on the chart that links several previous price points dating back to the swing high in July of last year.
If the shares manage to surpass this level, it could lead to an upward move towards the $32 area. Investors holding shares purchased at lower prices may seek exit points near this range, which is in proximity to several peaks just below the stock’s January high.
For projecting a price target above this year’s high, investors can utilize a bars pattern tool. Applying this method involves extending the stock’s uptrend from October to January over the falling wedge pattern’s top trendline, estimating a potential target around $42—approximately 60% above Thursday’s closing price, which could trigger profit-taking among investors.
Interestingly, the preceding trend adhered to a falling wedge pattern, offering insights into how future movements may unfold.
Crucial Support Level to Watch
During retracements, GameStop investors will likely focus on the $25 level, where a confluence of support exists, featuring the upward sloping 200-day moving average, this month’s low, and the stock’s peak from September.
The insights, opinions, and analyses presented here are for informational purposes only. For further details, refer to our warranty and liability disclaimer.


