
Essential Insights
- AppLovin’s stock surged nearly 30% in after-hours trading on Wednesday.
- The AI-driven advertising company exceeded analyst forecasts for its fourth-quarter earnings while providing an optimistic outlook for the current quarter.
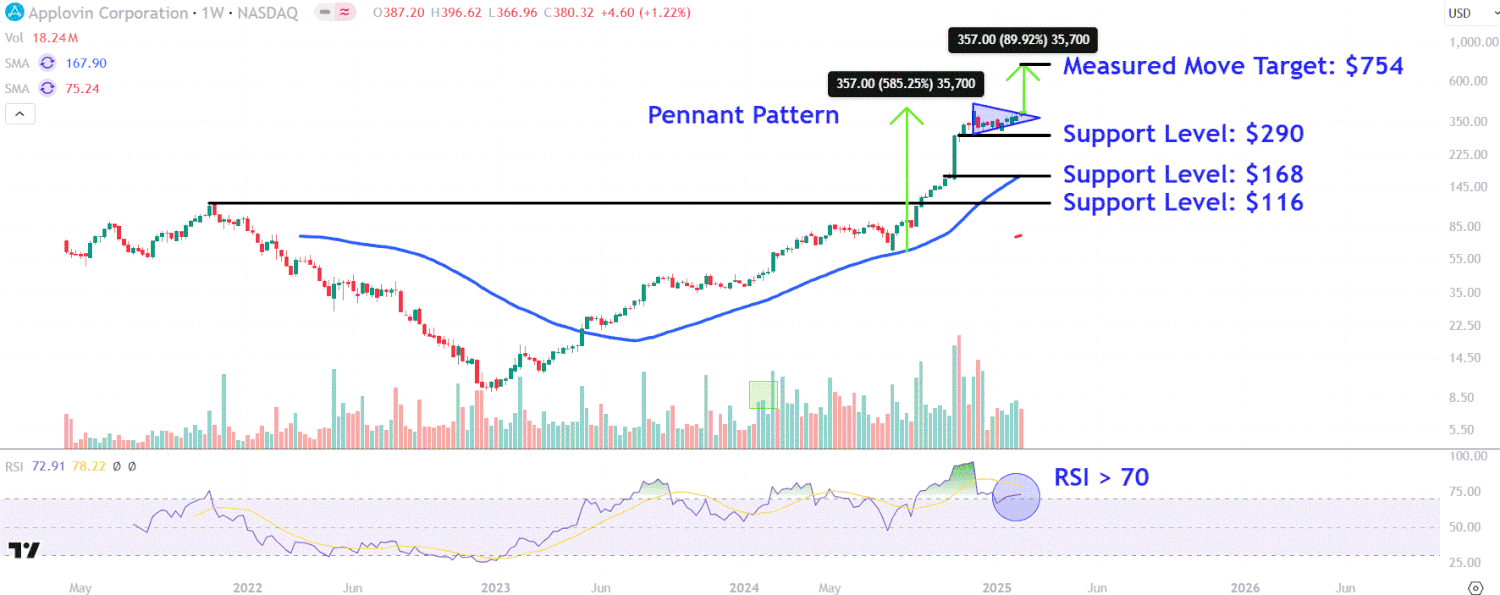
- On Thursday, the stock is poised to break out of a pennant pattern, paving the way for further gains.
- The measured move analysis predicts a target price of $754.
- Investors should keep an eye on critical support levels for AppLovin at approximately $290, $168, and $116.
AppLovin (APP) witnessed a remarkable rise of nearly 30% in after-hours trading on Wednesday. This surge followed the company’s announcement that its AI-powered advertising platform surpassed Wall Street’s earnings expectations for the fourth quarter and provided a promising outlook for the upcoming quarter.
AppLovin specializes in software that aids in the monetization of gaming applications through targeted advertising. The company has forecasted first-quarter revenue in the range of $1.36 billion to $1.39 billion, exceeding analysts’ expectations of $1.32 billion. Management indicated that $1 billion of net sales is projected to stem from AppLovin’s advertising segment, highlighting that the company is still in the preliminary phases of enhancing its AI systems.
As of Wednesday’s market closing, AppLovin’s shares have risen 17% since the beginning of the year and have climbed over 700% in the past twelve months, driven by increasing demand for the company’s AI-integrated advertising solutions.
Below, we delve into the technical analysis of AppLovin’s weekly chart to highlight important price levels following its earnings report.
Breakout from Pennant Pattern
Following its all-time high in early December, AppLovin stock has been consolidating within a pennant pattern, which signals a potential continuation of the stock’s upward trend.
The stock appears on track for a significant increase on Thursday, setting the foundation for its next upward movement.
While the relative strength index (RSI) supports bullish momentum with a reading above 70, any ascension into overbought territory raises the possibility of pullbacks linked to profit-taking.
Let’s utilize technical analysis to establish an upside price target and pinpoint several crucial support levels that may come into play during potential retracements.
Price Target from Measured Move
To estimate an upside price target, investors can employ the measured move technique, commonly referred to as the measuring principle.
When applying this analysis to AppLovin’s chart, we determine the distance of the preceding uptrend before the pennant in points and add that amount to the upper trendline of the pattern.
For instance, we add $357 to $397, resulting in an upside price target of $754, where investors may consider to secure profits.
Important Support Levels to Monitor
In case of pullbacks, the stock may initially dip to approximately $290. This level might provide support near the low point of the pennant pattern, closely aligning with the closing price of a notably wide-ranging bar observed in early November.
Falling below this threshold may lead to a decline toward around $168, a price level where shares could draw purchasing interest near the essential 50-period moving average and a range of consolidation that occurred prior to last November’s election-driven surge.
Ultimately, a deeper correction in AppLovin’s stock could lead to a dip to lower support around $116. Investors utilizing buy-and-hold strategies might seek entry opportunities in this vicinity, especially near the stock’s notable swing high from November 2021.
The opinions and insights presented on Investopedia are for informational purposes only. Please refer to our warranty and liability disclaimer for additional details.
As of the date this article was published, the author does not hold any of the securities mentioned above.